Fig. 2.
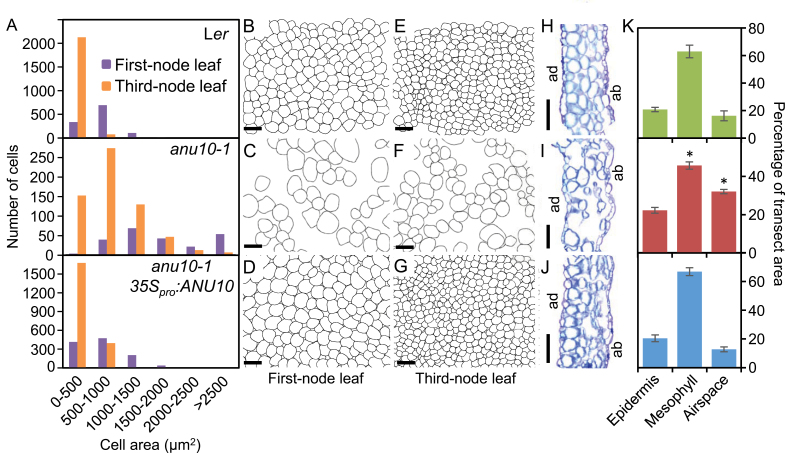
Morphometry of anu10-1 mesophyll cells. (A) Distribution of palisade mesophyll cell area in first- and third-node leaves from Ler, anu10-1, and anu10-1 35S pro :ANU10 plants (n=8). (B–G) Representative diagrams of the subepidermal layer of palisade mesophyll cells from (B–D) first- and (E–G) third-node leaves. Diagrams were drawn from differential interference contrast pictures taken from cleared leaves. (H–J) First-node leaf transverse sections from (H) Ler, (I) anu10-1, and (J) anu10-1 35S pro :ANU10 plants. ad, adaxial surface, ab, abaxial surface. Scale bars indicate (B–G) 50 μm and (H–J) 500 μm. (K) Percentage of leaf transect area occupied by epidermis, mesophyll (including palisade and spongy mesophyll cells and bundle sheath cells), or air spaces in Ler (green), anu10-1 (red), and anu10-1 35S pro :ANU10 (blue) first-node leaves. Error bars indicate standard deviations. Asterisks indicate values significantly different from Ler in a Mann–Whitney U-test (P<0.01, n=6).

