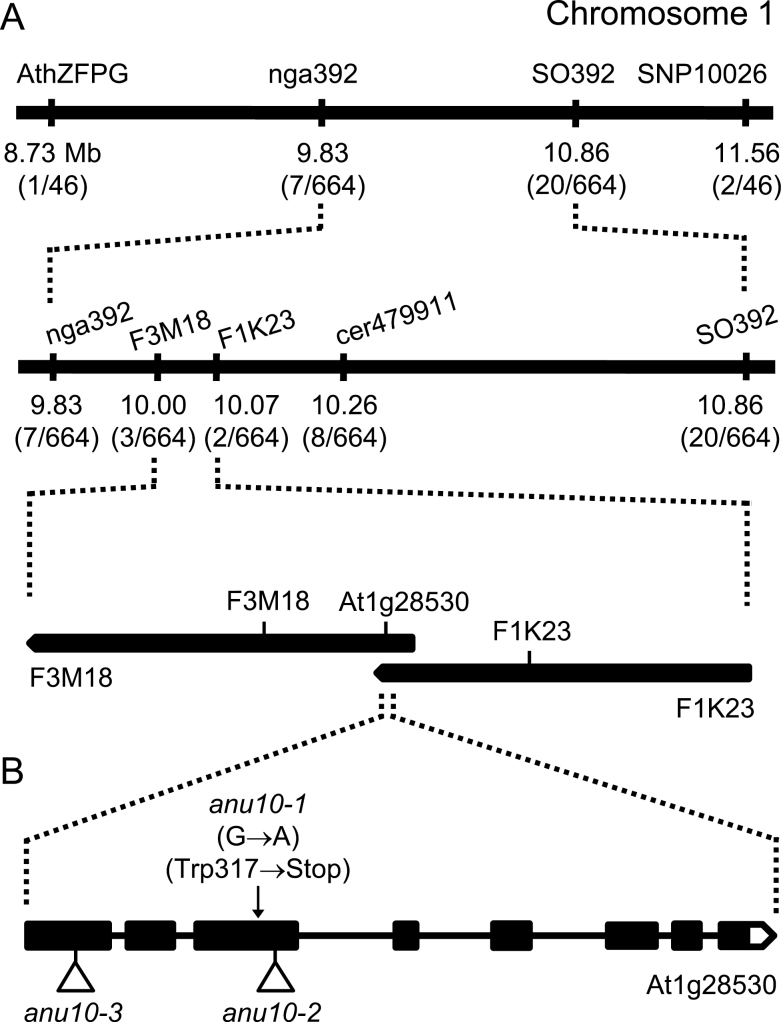
Fig. 3.
Positional cloning of ANU10. (A) A mapping population of 332 F2 plants derived from an anu10-1×Col-0 cross allowed a candidate region of 72kb to be defined in chromosome 1. Names and physical map positions of the molecular markers used for linkage analysis are shown. The number of recombinant chromosomes found and the total number of chromosomes analysed are indicated in parentheses. (B) Structure of the ANU10 gene with indication of the nature and position of the anu10 mutations. Boxes and lines indicate exons and introns, respectively. A white box represents the 3′-UTR. Triangles indicate T-DNA insertions.

