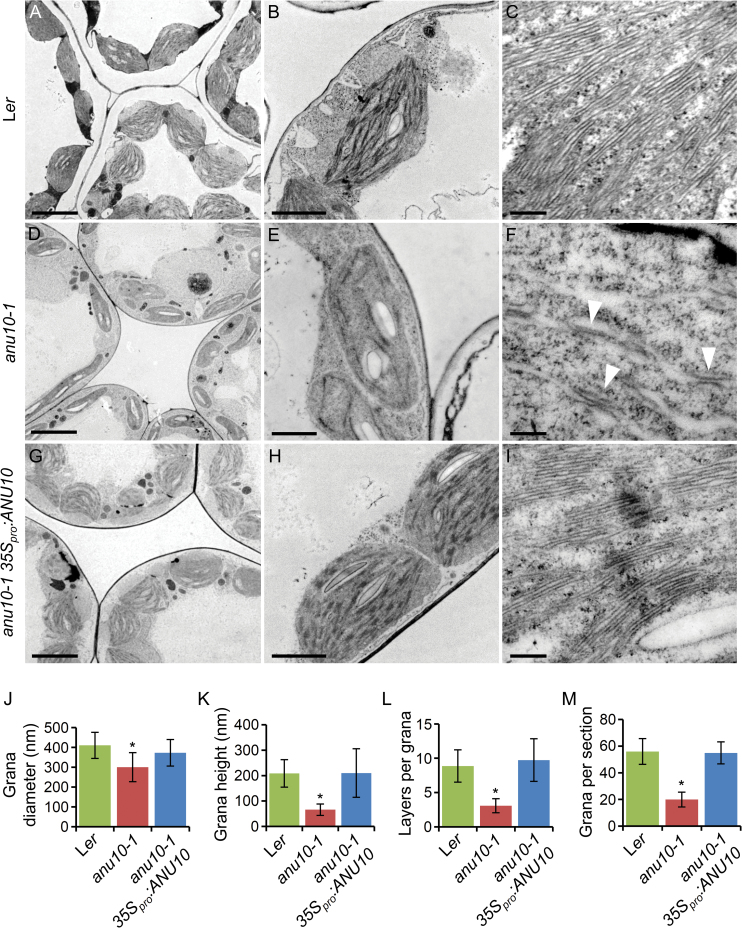
Fig. 7.
Ultrastructure of anu10-1 chloroplasts. Transmission electron micrographs of palisade mesophyll cell chloroplasts from (A–C) Ler, (D–F) anu10-1, and (G–I) anu10-1 35S pro :ANU10. Arrowheads in (F) indicate unstacked thylakoid membranes in the anu10-1 mutant. Pictures were taken from first-node leaves collected 16 das. Scale bars indicate (A, D, G) 5 μm, (B, H) 2 μm, (E) 1 μm, and (C, F, I) 200nm. (J–M) Comparison of (J) the diameter (x-axis) and (K) height (y-axis) of granal stacks, (L) the number of membrane layers in granal stacks, and (M) the number of stacks in chloroplast sections from Ler, anu10-1, and anu10-1 35S pro :ANU10. The number of grana per chloroplast section was determined from images of individual chroroplasts similar to those shown in B, E, and H. Asterisks indicate values significantly different from the wild type in a t-test (P<0.05, n=10–20).

