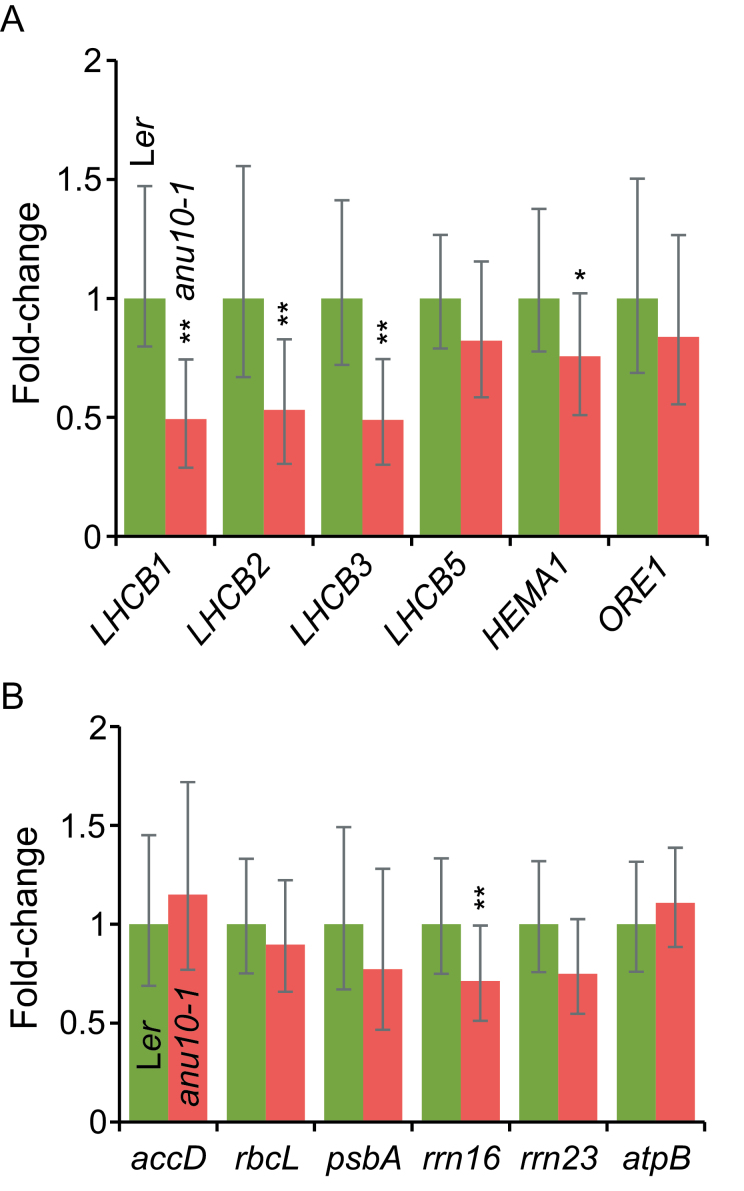
Fig. 9.
Expression of nuclear and plastid genes in the anu10-1 mutant. (A, B) qRT-PCR analysis of the expression of (A) LHCB1, LHCB2, LHCB3, LHCB5, HEMA1, and ORE1 nuclear genes, and (B) accD, psbA, rbcL, rrn16, rrn23, and atpB plastid genes in Ler and anu10-1 rosettes collected 16 das. Bars indicate the relative expression levels, determined by the comparative CT method, and normalized with the expression of the 18S rRNA housekeeping gene. Error bars indicate the interval delimited by 2–(ΔΔCT± SD). Asterisks indicate ΔCT values significantly different from those of Ler in a Mann–Whitney U-test (P<0.01; n=9).

