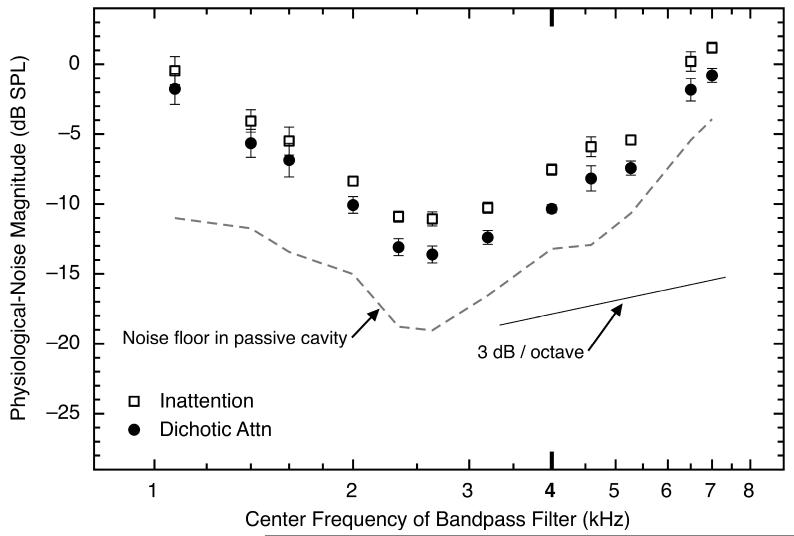
Fig. 7.
The asymptotic physiological-noise magnitudes as a function of frequency, averaged across the final 10 analysis windows of the silent period and across eight subjects for triplet 1 of the inattention and dichotic-attention conditions. The data from the inattention condition are shown as open squares and the data from the dichotic-listening condition are shown as black circles. Error bars show one standard error of the mean. At each frequency, the physiological-noise waveforms were bandpass filtered using a bandwidth that was 10% of that particular frequency. The dashed line shows the mean level of the physical noise floor across experimental conditions, when measured in a passive cavity. The solid line is shown for comparison with the data; it has a slope of 3 dB per octave – the slope predicted by the use of a filter whose bandwidth doubles each octave.

