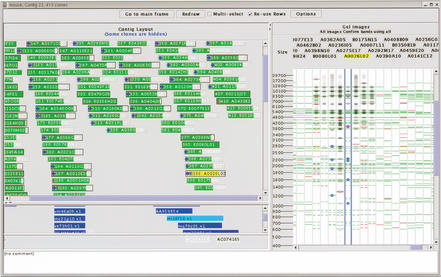
Figure 2.
Contig display for an arbitrarily chosen contig in the mouse FPC database. The layout of the clones within the contig is shown on the left, with colored boxes representing the left and right ends of the clone in the top area. Markers are shown in blue in the middle area, with the left and right ends indicating the left- and right-most ends od clones matching this marker. Remarks for the clones are show in the bottom area. The processed gel images for the clones are shown on the right side of the display, with restriction fragment locations indicated with horizontal lines. Green lines indicate restriction fragments confirmed by neighboring clones and red indicates unconfirmed restriction fragments. A ruler on the left side of the gel image area indicates the size of restriction fragments (shown here) or mobility depending on the software configuration. Restriction fragments marked by the user are labeled with (x) symbols.

