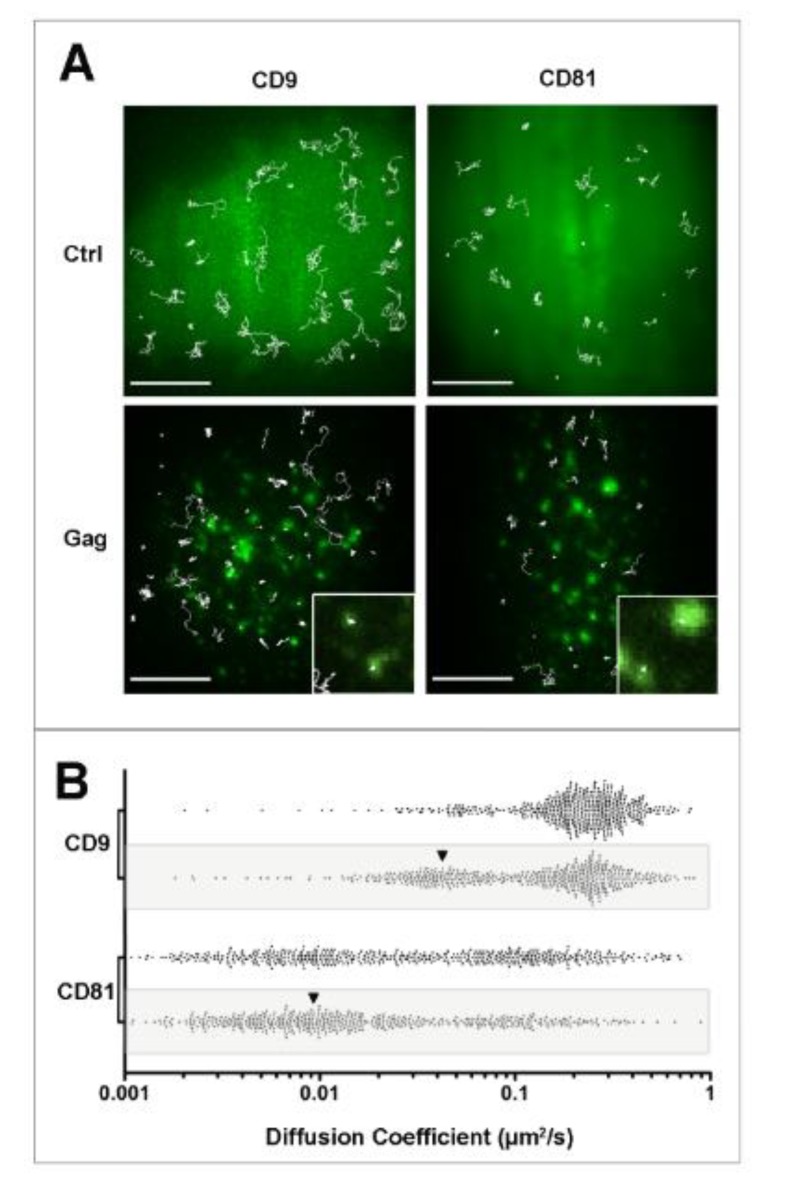
Figure 2.
Single molecule analysis of CD9 and CD81 behavior during HIV-1 budding. Panel A: Micrographs showing the superimposition of ensemble labeling of GFP (control) or Gag fused to GFP (Gag) fluorescence signal with several representative single molecule trajectories (white lines) obtained after tracking Atto647N-conjugated Fab fragments of anti-CD9 or anti-CD81 antibodies in HeLa cells. Upon gag expression, dynamics of both tetraspanins was decreased, quantitated in panel B, mainly due to their confinement. The insets correspond to a zoom where confinements of CD9 and CD81 in Gag-enriched areas are observed. A larger effect was observed for CD9 because it is much more dynamics than CD81 under native conditions (see control panels and scatter plots in B). Scale bars represent 10 µM. Panel B shows scatter plots representing the distribution of all the apparent diffusion coefficients of CD9 and CD8, calculated from the MSD-time lag plot in control or in Gag-expressing (grey box) cells. Each dot represents one trajectory (500 trajectories are shown here). The black arrowheads highlight the increase in confined trajectories (adapted from [69]).

