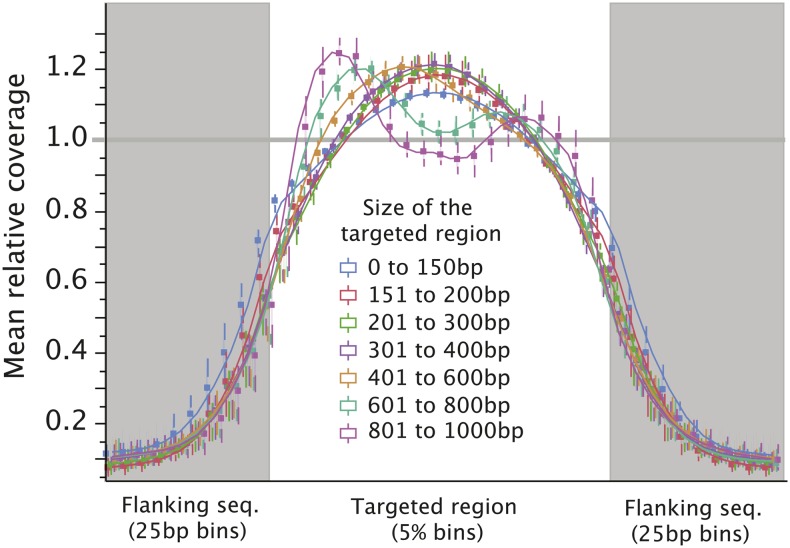
Figure 2.
Variation in Coverage across Targeted and Flanking Regions of the Rice Genome.
For each targeted region, the mean coverage was calculated and variation in coverage along the length of the region was plotted. Coverage on the regions flanking the targeted region was calculated relative to that average. Means for all target regions of a certain size were averaged. As expected, coverage drops rapidly outside of the targeted region. We were unable to explain the bimodal nature of the coverage curve corresponding to longer targets (visible in the 601 to 800 bp and even more pronounced for the 801 to 1000 bp category). Only captures 2, 3, and 4 were used for this analysis as probe targeting was not successful for capture 5 (<10-fold enrichment in target sequences; Table 1; Supplemental Figure 1) and capture 1 failed at the level of sequencing.

