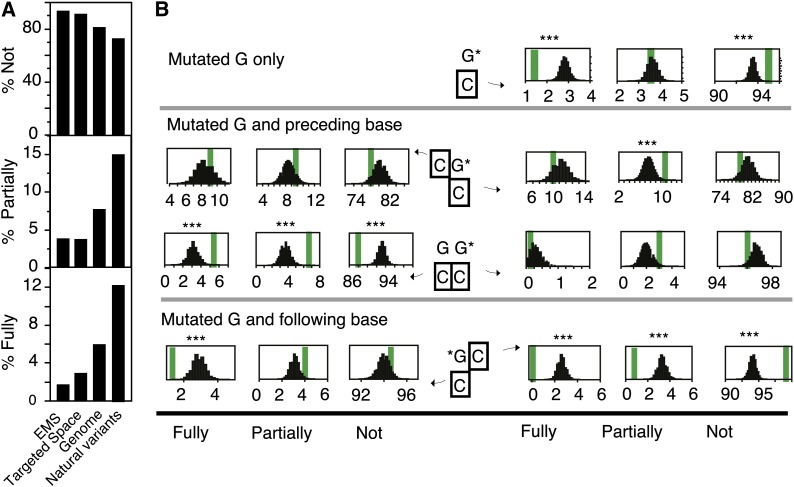
Figure 8.
Relationship between Cytosine Methylation and EMS Targeting in Rice.
(A) Comparison of cytosine methylation levels in different sets of positions. The mean percentages over all sites are represented by the height of the bars. The different sets of positions compared are: positions of all mutations identified in the rice EMS-mutagenized individuals (EMS), all positions in the targeted space, all positions in the rice genome, and positions of naturally variant positions between O. glaberrima and O. sativa variety Nipponbare.
(B) Observed (thick vertical bars) and expected (distribution of values) percentages of fully, partially, and nonmethylated cytosines opposite and/or flanking the mutated guanines. The top panel shows data for all mutated guanines at once. The bottom two panels depict how these percentages vary depending on the nucleotide context.
For both panels, the percentages of fully methylated (Fully), partially methylated (Partially), and unmethylated (Not) cytosines were calculated. Data for all possible dinucleotides are represented in Supplemental Figure 6, while this figure is limited to those that are significantly different from the controls. For each graph, the thick vertical line represents the observed percentages from the mutated positions. The number of positions included in the calculation of those percentages depended on the number of observed mutations (N) for which methylation data were available. The distribution of expected percentages upon random selection of N nucleotides or dinucleotides for which methylation data are available is shown (100,000 random samplings). G*, guanine residues that were found to be mutated in our captured individuals. The cytosine residue for which the methylation state is evaluated is surrounded by a black square. ***, Less than 10/100,000 random samples exhibited values further from the mean of the distribution than the observed mean (line).
[See online article for color version of this figure.]

