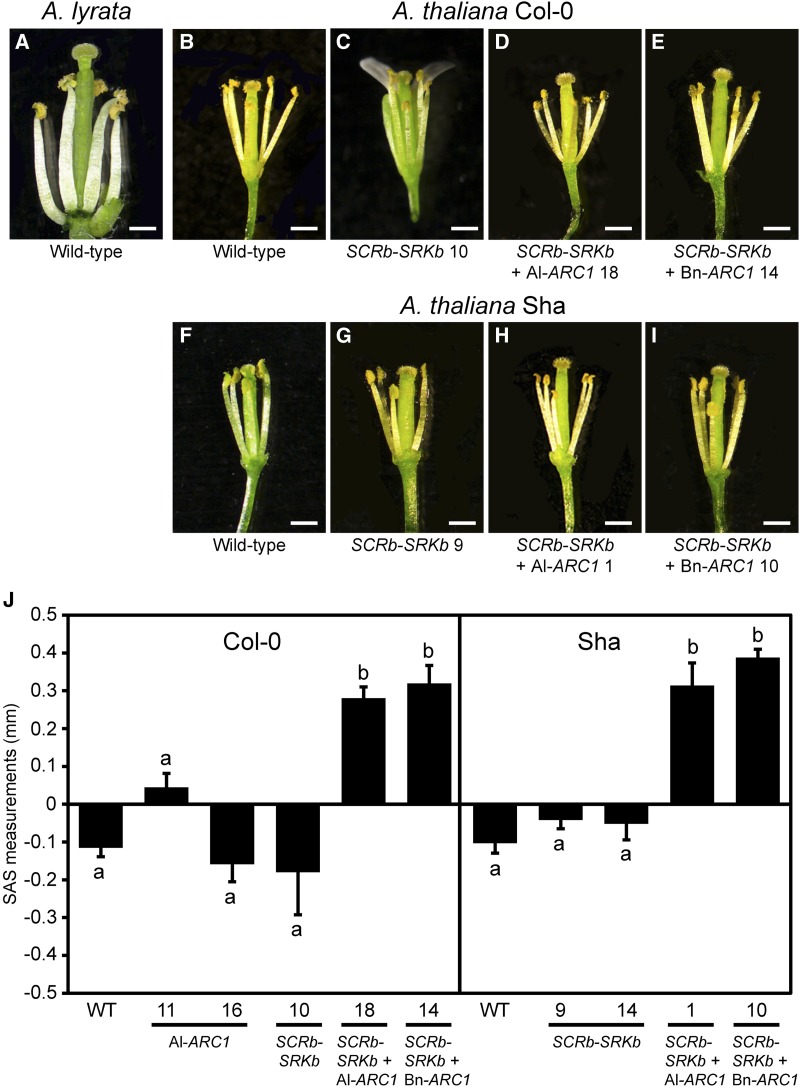
Figure 3.
Approach Herkogamous Phenotypes in Transgenic A. thaliana Col-0 and Sha SCRb-SRKb-ARC1 Plants at Anthesis.
(A), (B), and (F) Flowers from wild-type A. lyrata, A. thaliana Col-0, and A. thaliana Sha plants.
(C) to (E) Flowers from A. thaliana Col-0 transgenic plants: SCRb-SRKb #10, SCRb-SRKb + Al-ARC1 #18, and SCRb-SRKb + Bn-ARC1 #14.
(G) to (I) Flowers from A. thaliana Sha transgenic plants: SCRb-SRKb #9, SCRb-SRKb + Al-ARC1 #1, and SCRb-SRKb + Bn-ARC1 #10. Bars = 500 µm.
(J) Mean SAS measurements (Luo and Widmer, 2013) for transgenic A. thaliana Col-0 and Sha flowers. n = 9 flowers per sample. Error bars indicate se. The different letters represent means that are significantly different at P < 0.05 (one-way ANOVA with Tukey-HSD post-hoc tests).
[See online article for color version of this figure.]

