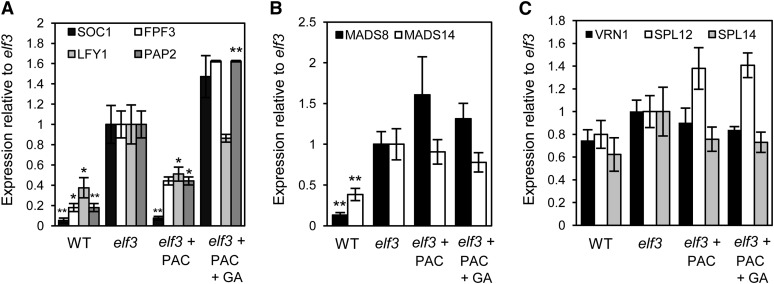
Figure 3.
Expression Analysis of Floral Identity Genes in the Developing Apex.
Quantitative RT-PCR analysis of floral identity genes in developing inflorescences of wild-type and elf3 plants identifies genes that are GA dependent (A), more highly expressed in elf3 than in the wild type but not responsive to changes in GA levels (B), or equally expressed in wild-type and elf3 plants (ELF3 independent) (C). PAC and GA3 treatment concentrations were 1 μM and 10−7 M, respectively. Plants were grown in SD conditions, and apex samples were collected from plants at the fourth leaf stage. Data are the mean ± se of three biological replicates, each containing six developing inflorescences (*P < 0.05; **P < 0.01).

