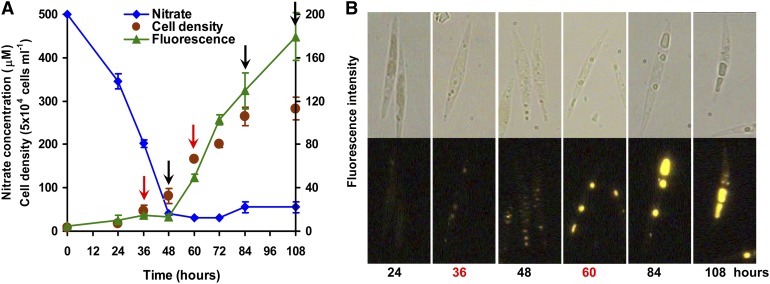
Figure 1.
TAG Accumulation and Nitrate Concentration Changes over Time.
(A) Time course of cell density, nitrate concentration in culture media, and accumulation of TAGs (fluorescence intensity normalized to cell number) detected by Nile red assay in P. tricornutum. Arrows indicate the time at which samples were prepared for proteomic (red) and quantitative real-time PCR analysis (black and red).
(B) Microscopy images (above, bright field; below, Nile red fluorescence) of Nile red–stained cells grown in f/2 (NaNO3 concentration was reduced to 500 μM) enriched artificial seawater medium for 24, 36, 48, 60, 84, or 108 h.

