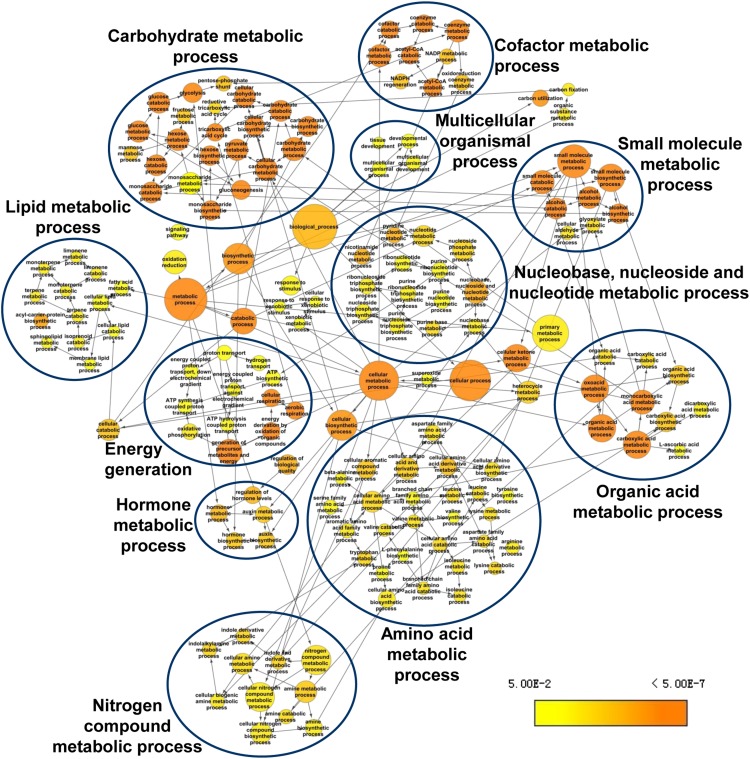
Figure 2.
GO Term Overrepresentation Analysis of Biological Processes.
Overrepresentation analysis of proteins significantly overexpressed during TAG accumulation in P. tricornutum is shown, with respect to their GO terms describing biological processes, analyzed with the Cytoscape plug-in BiNGO 2.4. The enriched GO terms are shown as nodes connected by directed edges that indicate hierarchies and relationships between terms. Node size is proportional to the number of proteins belonging to the functional category. Node color indicates the corrected P value for the enrichment of the term according to the color legend. The enriched GO terms are divided into 11 clusters as indicated according to their biological function. The corrected P < 0.05 was considered to be significant.
[See online article for color version of this figure.]

