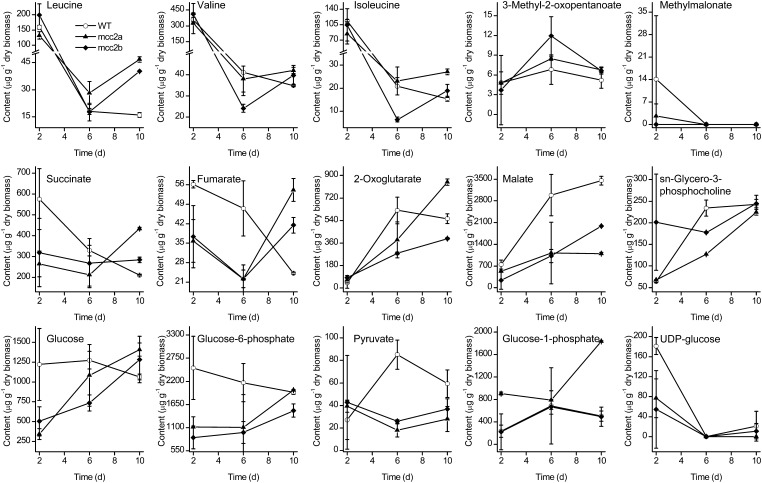
Figure 6.
Metabolite Content in Wild-Type and Two RNAi Silenced Lines (mcc2a and mcc2b).
Cultures were grown in f/2 (NaNO3 concentration was reduced to 500 μM) enriched artificial seawater medium, and metabolites were analyzed at days 2, 6, and 10. Error bars represent se of three biological replicates.

