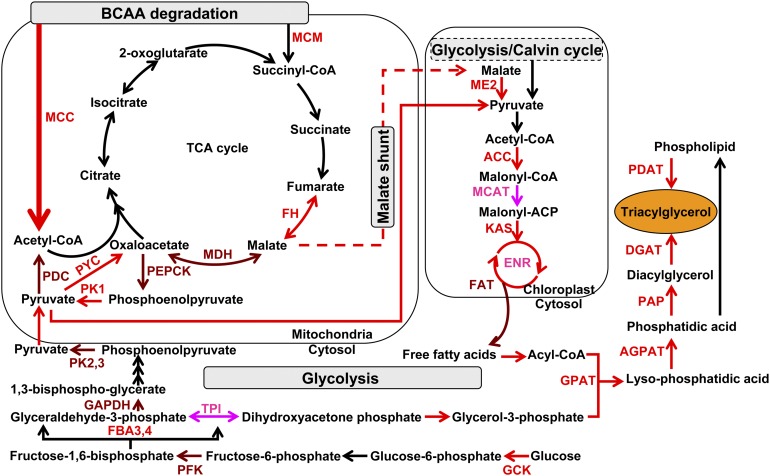
Figure 7.
Putative Simplified Model of Metabolic Pathways Responsible for TAG Accumulation.
Upregulated proteins detected by proteomic analysis are illustrated in pink, transcriptionally upregulated genes in red, and genes detected to be upregulated at both transcript and protein (proteomic) levels in brown. The metabolic processes in which these proteins are involved in subcellular organelles is shown according to KEGG pathway annotation. FH, fumarate hydratase; MDH, malate dehydrogenase; PEPCK, phosphoenolpyruvate carboxykinase; PK, pyruvate kinase (PK1, mitochondrial PK; PK2 and PK3, cytosolic PK); PDC, pyruvate dehydrogenase; PYC, pyruvate carboxylase; ME2, plastidial malic enzyme; ACC, acetyl-CoA carboxylase; MCAT, malonyl-CoA:ACP transacylase; KAS, 3-ketoacyl-ACP synthase; FAT, fatty acid acyl ACP thioesterases; GPAT, glycerol-3-phosphate O-acyltransferase; AGPAT, 1-acylglycerol-3-phosphate O-acyltransferase; PAP, phosphatic acid phosphatase; DGAT, diacylglycerol O-acyltransferase; PDAT, phospholipid:diacylglycerol acyltransferase; GCK, glucokinase; PFK, 6-phosphofructokinase; FBA, fructose bisphosphate aldolase (FBA3 and FBA4, cytosolic FBA); GAPDH, glyceraldehyde-3-phosphate dehydrogenase; ENR, enoyl-acyl carrier protein reductase; TPI, triose-phosphate isomerase.

