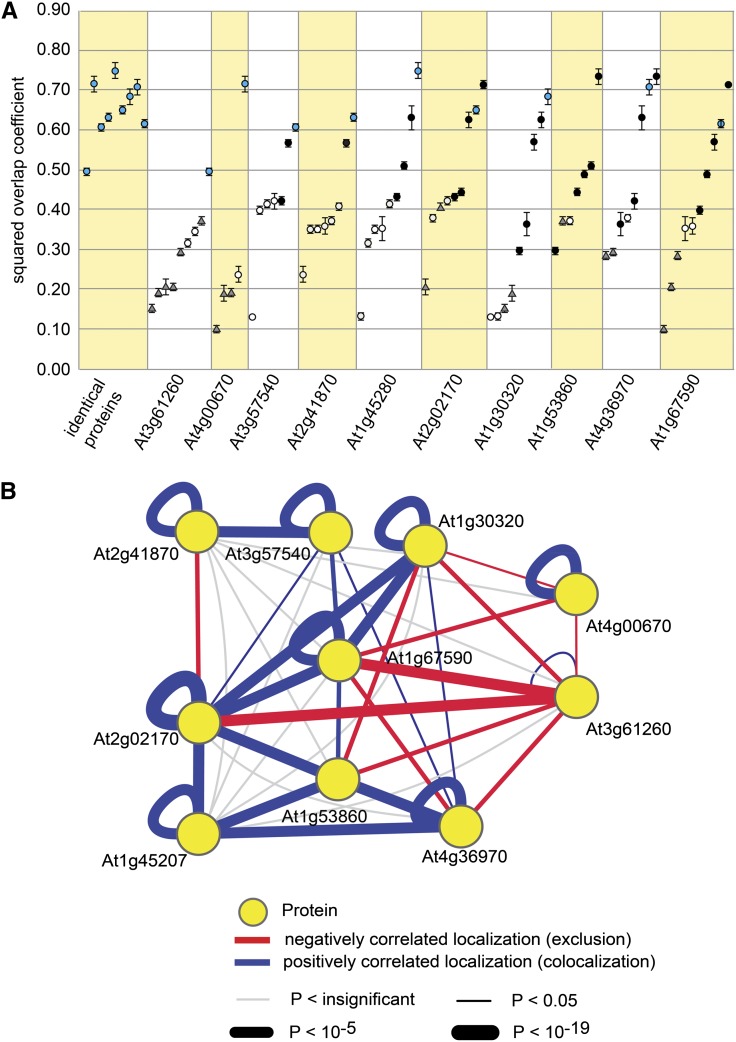
Figure 8.
Quantifications and Network Analysis of Membrane Domain Colocalizations.
(A) R2 values of all tested combinations were plotted in relation to individual proteins. The columns show R2 values for identical protein pairs (blue circles) that all showed positive correlations. For all other combinations, positive correlations are depicted as black circles, randomly colocalizing combinations as white circles, and pairs with negative correlation as gray triangles. Error bars represent se.
(B) Network analysis of domain colocalizations revealed that Remorins of subgroup 6 often colocalized, while proteins such as At3g61260 and At4g00670 represent particular membrane domains or compartments.

