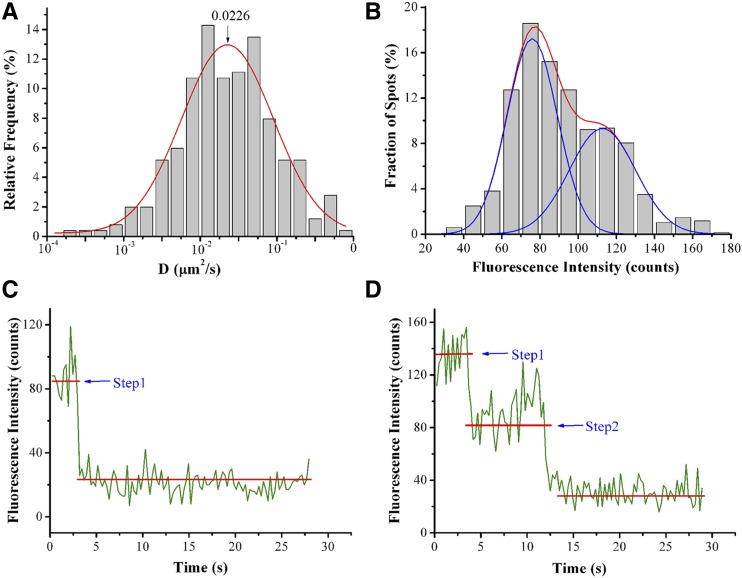
Figure 3.
Diffusion Coefficient Distribution, Fluorescence Intensity, and Oligomeric State Analysis of GFP-RbohD Foci at the Plasma Membrane.
(A) Distribution of diffusion coefficients (D) of GFP-RbohD spots on the epidermal cell plasma membrane (n = 526 spots).
(B) Distribution of fluorescence intensities of GFP-RbohD spots in living cells (n = 688 spots).
(C) Time courses of GFP emission after background correction, showing one-step bleaching.
(D) Time courses of GFP emission after background correction, showing two-step bleaching. The amplitude of each step was similar to that of single purified GFP molecules observed on cover slips (Supplemental Figure 2).

