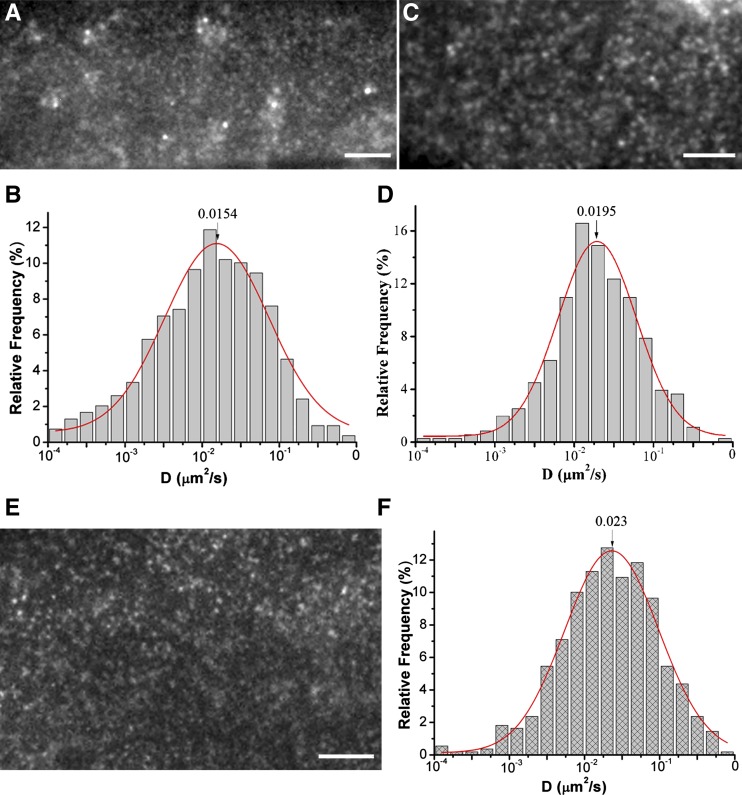
Figure 5.
Interruption of the Clathrin-Dependent Pathway Affects GFP-RbohD Foci Dynamics at the Plasma Membrane.
(A) VA-TIRFM image of epidermal cells fluorescently labeled with GFP-RbohD and treated with TyrA23. Bar = 5 μm.
(B) Distribution of GFP-RbohD diffusion coefficients on the epidermal cell plasma membrane in the presence of TyrA23 (n = 475 spots).
(C) VA-TIRFM image of GFP-RbohD in the chc2-1 mutant. Bar = 5 μm.
(D) Distribution of GFP-RbohD diffusion coefficients on the epidermal cell plasma membrane in the chc2-1 mutant (n = 430 spots).
(E) VA-TIRFM image of epidermal cells fluorescently labeled with GFP-RbohD and treated with TyrA51. Bar = 5 μm.
(F) Distribution of GFP-RbohD diffusion coefficients on the epidermal cell plasma membrane in the presence of TyrA51 (n = 612 spots).
[See online article for color version of this figure.]

