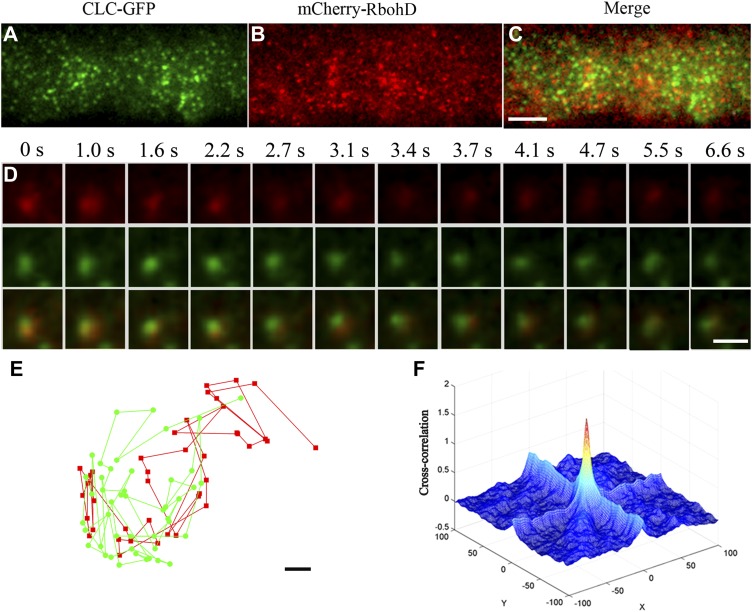
Figure 6.
CLC-GFP and mCherry-RbohD Foci Colocalized at the Plasma Membrane.
(A) to (C) Seedlings expressing CLC-GFP and mCherry-RbohD imaged by VA-TIRFM.
(D) Corresponding mCherry-RbohD (top), CLC-GFP (middle), and merged (bottom) images for which the intensities were measured are shown below the time points indicated.
(E) The trajectories of colocalized spots of mCherry-RbohD and CLC-GFP. The mCherry-RbohD spot and CLC-GFP spot diffused together on the plasma membrane and kept their distances within ∼100 nm.
(F) CLC-GFP and mCherry-RbohD 3D cross-correlation plot as a function of pixel shift.
Bars = 5 μm in (A) to (C), 1 μm in (D), and 0.05 μm (E).

