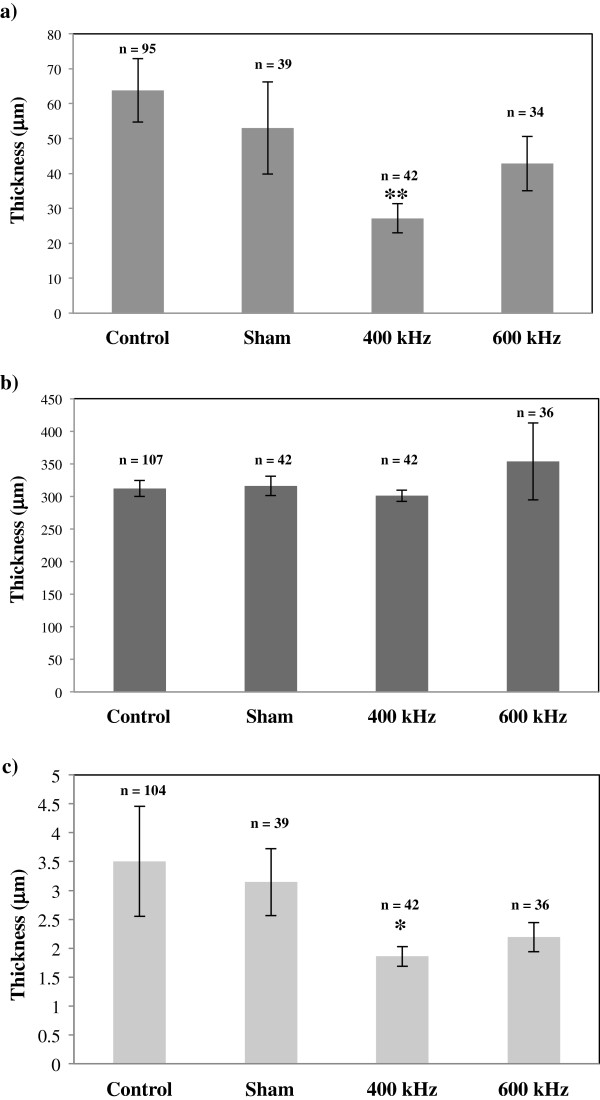
Figure 7.

Thickness of different layers of the cornea. This graph shows thickness of the different layers of the cornea: (a) epithelium, (b) stroma, and (c) endothelium. Different bars represent results for control, sham-treated, 400- and 600-kHz-ultrasound-treated samples. *p value <0.05 as compared to sham values; **p value <0.001 as compared to control values.
