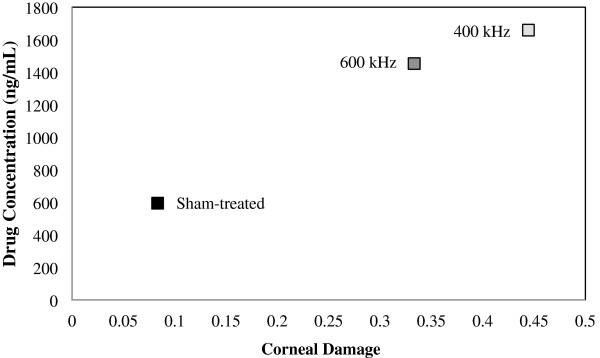
Figure 8.

Relation between drug concentration in aqueous humor and corneal damage. This figure shows a relationship between corneal damage and drug concentration in the aqueous humor for ultrasound- and sham-treated cases. Data are given as mean ± standard deviation.
