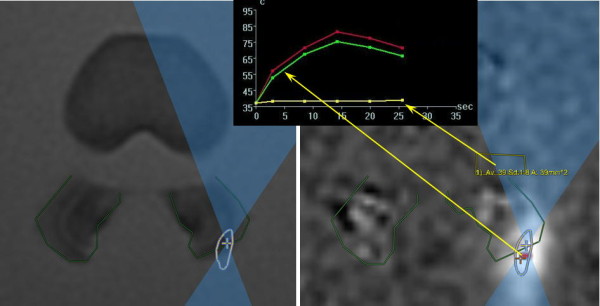
Figure 2.

Temperature measurements at the point of focus and in the far field, adjacent to the intervertebral foramen. As measured during sonication #13 (900 J). Red (maximum) and green (average) temperature curves represent the point of focus; yellow temperature curve represents the far field, adjacent to the intervertebral foramen.
