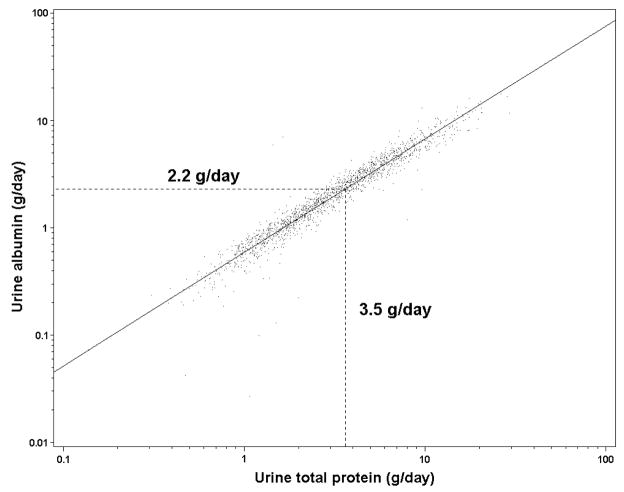
Figure 3. Relationship of log transformed urine albumin and log transformed total total protein.
Linear regression line (solid)Values for albumin are approximately 0.6 times the values for total protein; 2.2 g/d (95% confidence interval 1.4-3.5g/d) is the urine albumin equivalent of nephrotic-range total protein, 3.5 g/d (small dashed line).

