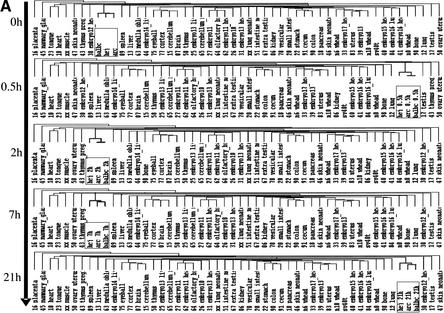
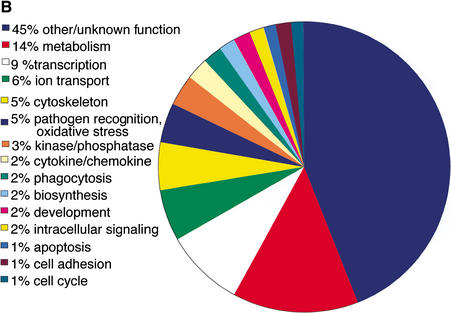
Figure 1.
(A) Comparison of BMM expression profiles during a LPS time-series with the READ mouse tissues expression profiles database on the RIKEN 19,000 element cDNA arrays. The expression profiles of 49-mouse tissue from different developmental stages are compared in hierarchical matter with the expression profiles of BMM from three different mouse strains (BALB/c, C3H/ARC, and C2H/HeJ). The picture shows the experiment trees generated using the unsupervised hierarchical clustering algorithm from GeneSpring4.2 (SiliconGenetics Inc.).
(B) Annotation of the 347 macrophage-enriched genes. The ontology pie was based on the RIKEN clone annotation, curated by the Functional Annotation of Mouse Genome consortium (FANTOM). Further information regarding these genes can be found in Supplementary Table 1.


