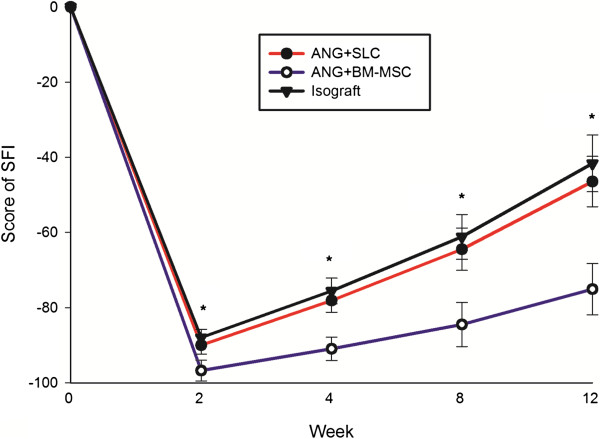
Figure 3.

The quantitative analysis of SFI value. Typical walking tracks were obtained from the three experimental groups at 0, 2, 4, 8 and 12 weeks after surgery, and the SFI value was calculated. The SFI values in the isograft and ANG + SLC groups were significantly higher than in the ANG + BM-MSC group. The data are shown as the mean ± SEM, *P < 0.05 vs. the ANG + BM-MSC group (n = 15).
