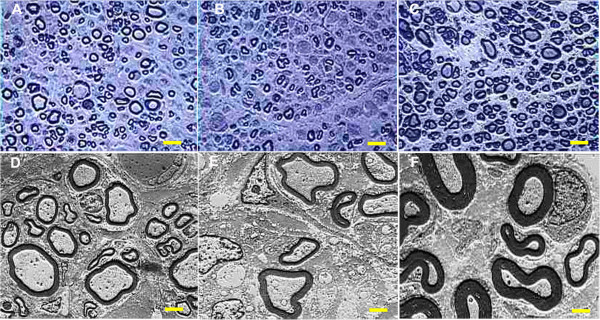
Figure 6.

Toluidine blue staining and transmission electron micrographs at 12 weeks postoperatively. Toluidine blue staining (A-C, scale bar = 10 μm) and transmission electron micrographs (TEM, D-F, scale bar = 2 μm) at 12 weeks postoperatively in the ANG + SLC (A and D), ANG + BM-MSC (B and E) and isograft (C and F) groups. The isograft group showed numerous large well-myelinated axons. The ANG + SLC group also demonstrated a large number of mature axons, whereas the ANG + BM-MSC group displayed generally fewer, small fibers.
