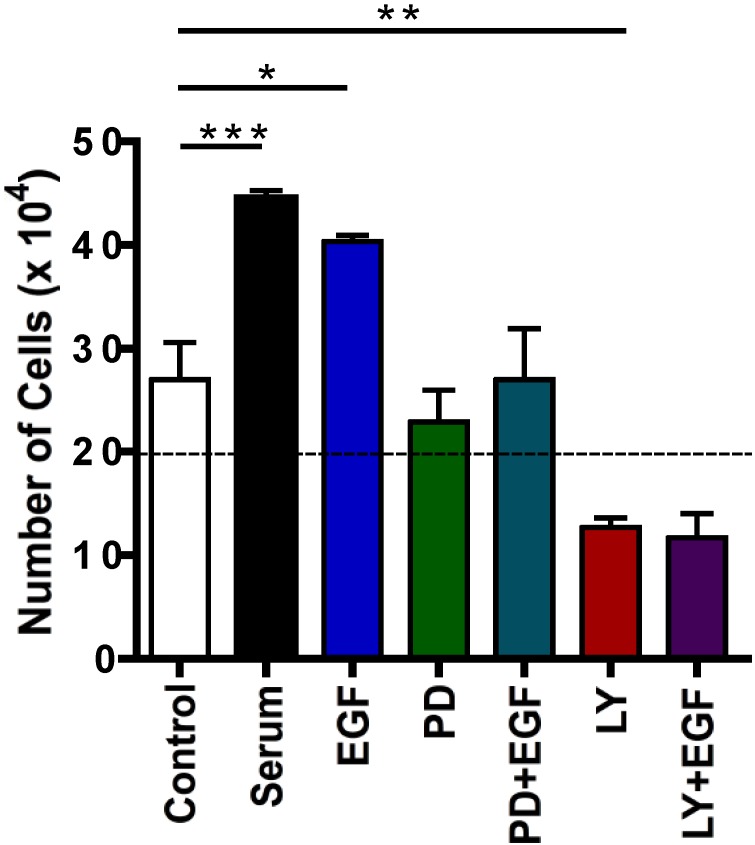
Figure 3.
Effects of inhibitors on EGF-induced proliferation in C5 cells. Equal numbers of C5 cells (2 × 10⁵) were plated and grown overnight. Cells were serum starved for 24 hours, then incubated for 24 hours in triplicate with and/or without 10% FBS (positive control), 10 nM EGF, 2 pM PD15878 (“PD”: EGFR inhibitor), or 25 μM LY290042 (“LY”; PI3K inhibitor). Following treatment, viable cells were counted. The dashed horizontal line indicates the number of cells originally plated. Each data point represents mean ± SD for three wells of cells. Statistical significance was determined using t-test: * p < 0.05; ** p < 0.02; *** p < 0.01.

