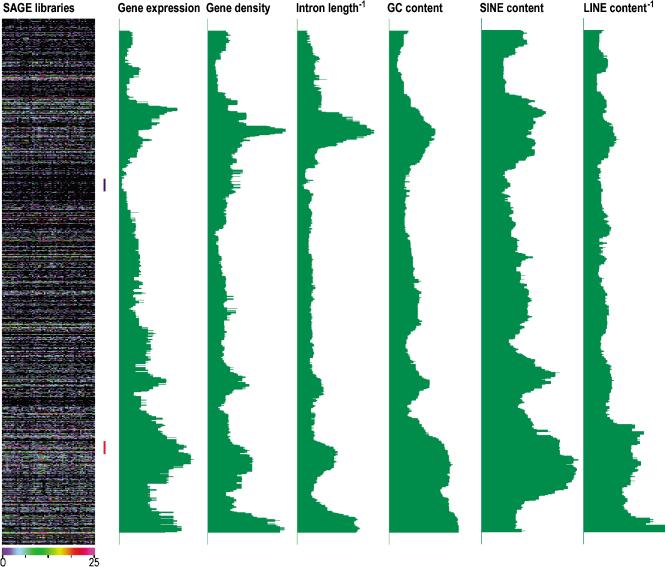
Figure 1.
Profiles of gene expression, gene density, inverse intron length, GC content, SINE density, and inverse LINE density of human chromosome 9. The left color chart shows expression data from 62 SAGE libraries of 50,000 or more transcript tags. Each horizontal line is a transcription unit (TU). Vertical rows are individual SAGE libraries. The levels of expression are given by a color code, ranging from zero to the here chosen maximum of 25 or more tags/100,000 transcript tags in a library; Green profiles: moving medians of the gene expression levels, gene density, inverse intron length, GC content, SINE density and inverse LINE density at window size 49. Expression levels are taken from all combined SAGE libraries, totaling to 5,959,046 tags (SAGE all tissues). See Figure 6 of the Supplemental Information for profiles of all human chromosomes.

