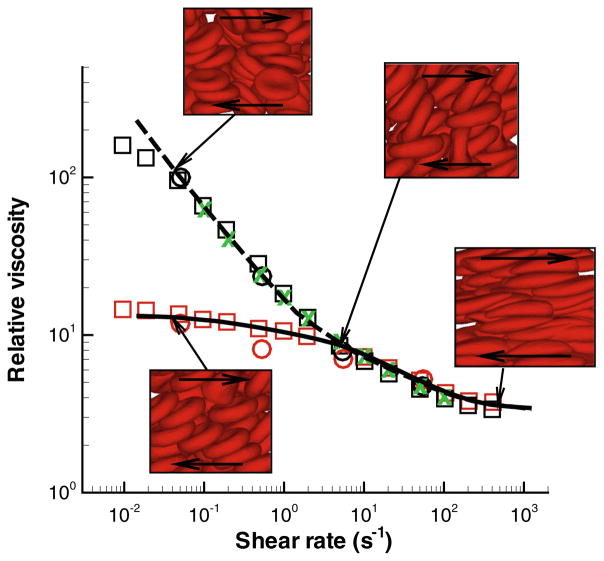
FIGURE 6.
Non-Newtonian relative viscosity of blood (the cell suspension viscosity divided by the solvent viscosity) as a function of shear rate at Ht = 0.45. The simulation curves are: dashed—whole blood model; solid—non-aggregating RBC suspension. The experimental data are as follows: Whole blood: green crosses—Merril et al.,106 black circles—Chien et al.,25 black squares—Skalak et al.141 Non-aggregating RBC suspension: red circles—Chien et al.,25 red squares—Skalak et al..141 The insets show simulation snapshots at different shear rates. The figure is reproduced with permission from Fedosov et al.62

