
Figure 2.
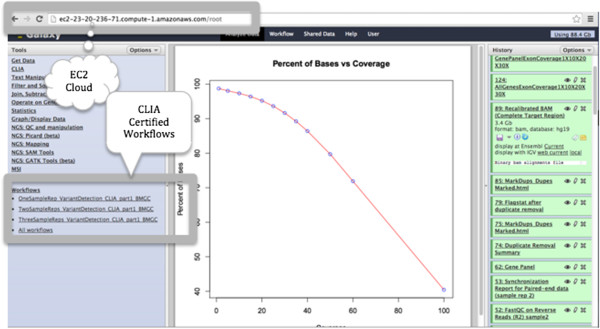
The Galaxy analysis pipeline. The URL gives a link to a virtual machine on the amazon cloud that runs the analysis pipeline. Galaxy interface is configured to make the CLIA certified workflows accessible as tools under the tools pane (left pane). The center pane shows results for one of the QC analyses (coverage plot outlining percent of bases with different levels of coverage). The right pane is a history of all the tools and the order in which they were executed by the pipeline together their results.