
Figure 6.
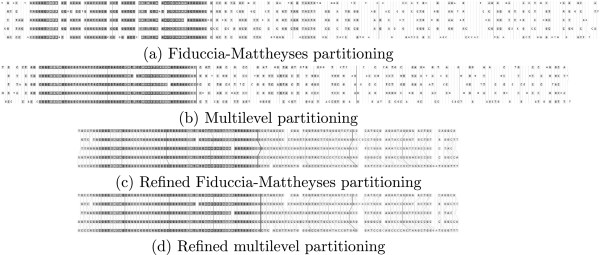
Example visualization of the alignment produced by the graph partitioning methods alone (ab) and graph partitioning followed by refinement (cd). Residue colors reflect how well the column is aligned based on residue match probabilities (darker is better). Partition cuts are colored to show the order of partitioning with darker cuts being performed earlier.