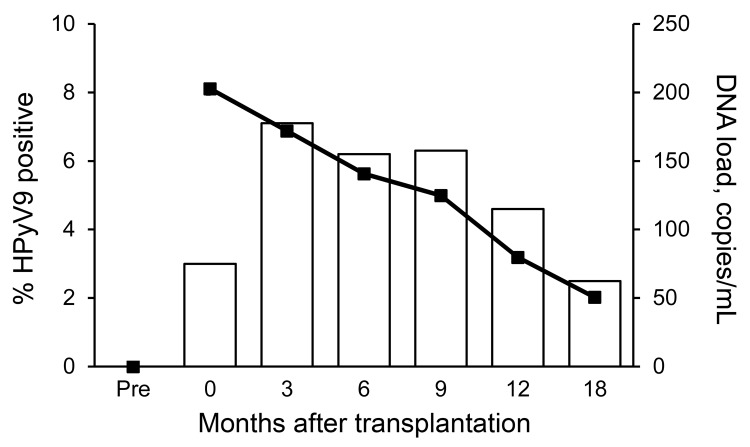
Figure 1.
Human polyomavirus 9 (HPyV9) DNA positivity and mean DNA viral load in transplant patients over time, the Netherlands. Bars indicate percentage of HPyV9-positive patients; line indicates DNA load. Time points are shown as described in Table 2. Pre, pretransplant (baseline).

