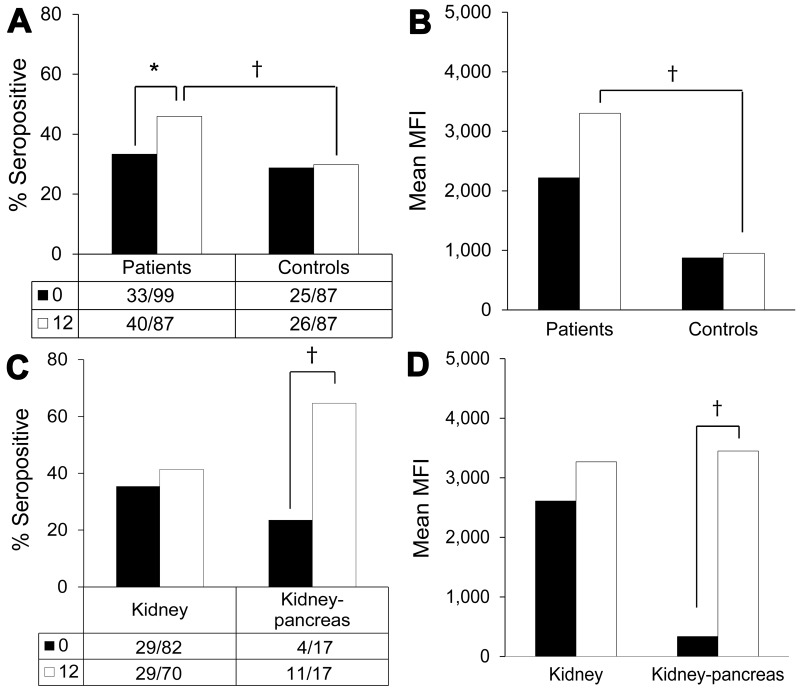
Figure 2.
Human polyomavirus 9 (HPyV9) seropositivity and seroreactivity in samples from transplant patients and healthy blood donor controls collected 1 year apart, the Netherlands. Black bars, baseline samples; white bars, follow-up samples (Table 2). Values below bars indicate no. persons positive/total no. tested. A) Seropositivity percentages for transplant patients and controls; B) seroreactivity levels for transplant patients and controls; C) seropositivity percentages for kidney transplant and kidney–pancreas transplant patients; D) seroreactivity levels for kidney transplant and kidney–pancreas transplant patients. MFI, median fluorescent intensity. *Borderline significant (0.05<p<0.100); †significant (p<0.05).

