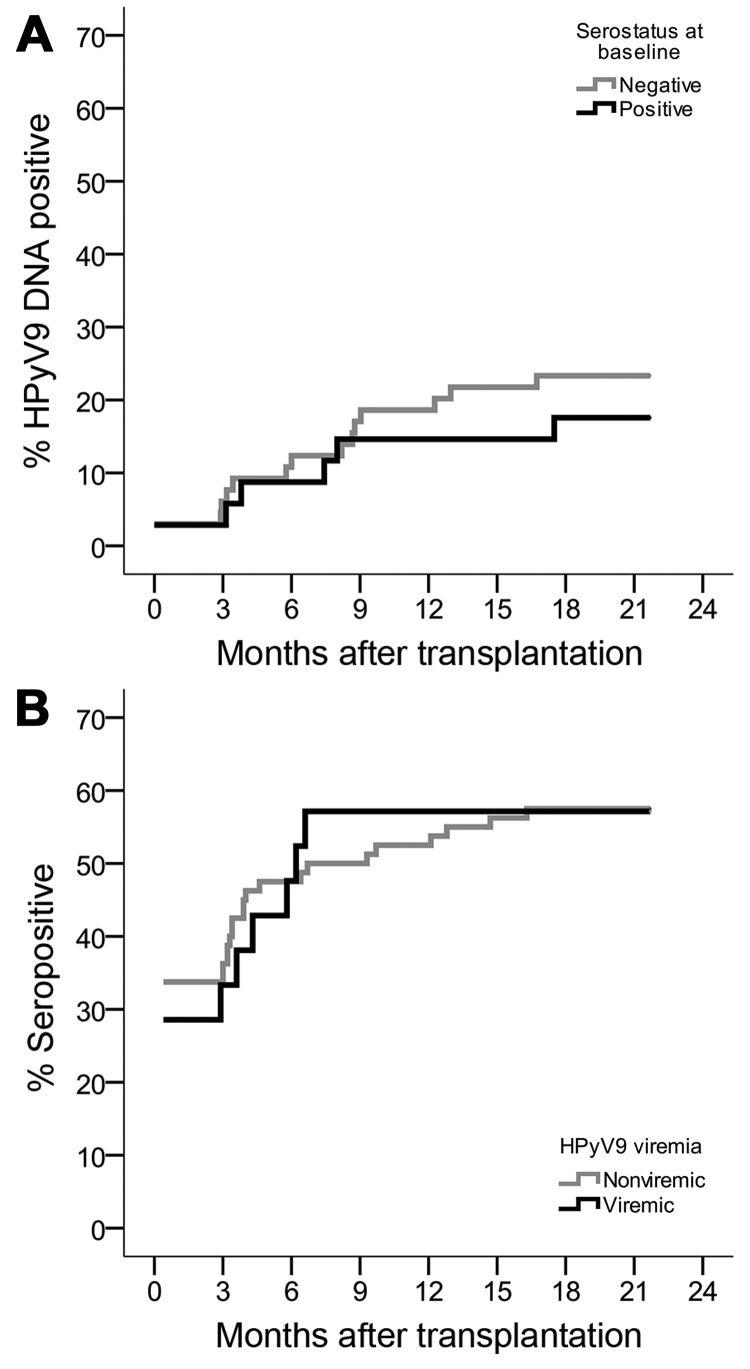
Figure 3.
Kaplan-Meier curves showing proportional increase of human polyomavirus 9 (HPyV9) DNA–positive and seropositive transplant patients during 12-month follow-up, the Netherlands. A) Cumulative HPyV9 DNA positivity (viremia) for transplant patients who were seronegative (gray) or seropositive (black) at baseline. B) Cumulative HPyV9 seropositivity for transplant patients who were nonviremic (gray) or viremic (black) at baseline.

