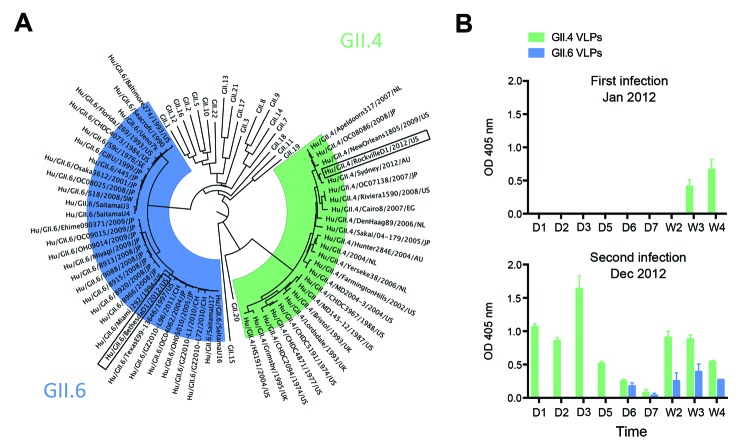
Figure 1.
Characterization of norovirus detected in stool samples and levels of local IgA responses for each infection. A) Phylogenetic tree of the major capsid protein (VP1) region from representative norovirus strains from each of the 22 genotypes within strain GII. Representative strains from each GII.4 and GII.6 cluster were compared with the strains reported in this article (boxed). For each strain, the name/year/country of isolation are shown. B) Levels of IgA in feces collected during the first (G11.4) and (G11.6) second infections. ELISA plates were coated with 1 μg/mL of each virus-like particle (VLP). Fecal samples were collected daily (D) and weekly (W), diluted to 1:500 in phosphate-buffered saline (pH 7.4), and tested for the presence of IgA with a polyclonal anti-human IgA conjugate. The experiment was performed twice in duplicate wells. Bars represent mean; error bars represent the standard errors of the mean. OD, optical density.

