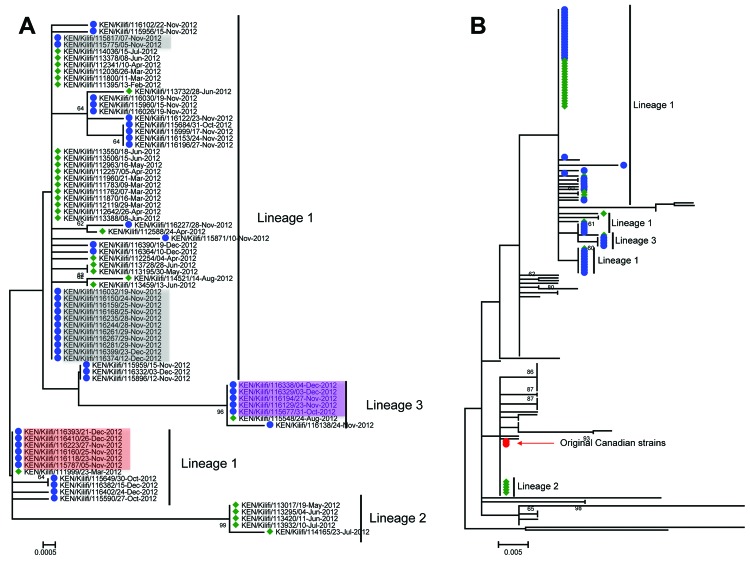
Figure 2.
Phylogeny of respiratory syncytial virus genotype ON1 viruses detected globally and from Kilifi, Kenya. A) Maximum-likelihood, nucleotide-based phylogenetic tree showing the evolutionary relationships of the 77 Kilifi ON1 viruses across the sequenced portion (702 nt long) of the attachment (G) protein gene. The taxon nomenclature on the tree is as follows: A 3-letter code representing country of isolation/(location within country of isolation, if provided)/GenBank accession number (or identification for Kilifi sequences)/date of isolation. Kilifi viruses identified during the first infection wave are preceded by a green diamond; those identified during the second infection wave are preceded by a blue circle. Highlighted names (i.e., red, gray, and purple, indicating viruses by taxa) had sequences identical to those for viruses from the first ON1 infection wave. B) Maximum-likelihood, nucleotide-based phylogenetic tree showing the evolutionary backbone structure of 118 global ON1 viruses sequences, together with the 77 Kilifi ON1 viruses sequences across the sequenced portion (333 nt long) of the G third C-terminus region. The positions of the Kilifi viruses from the first infection wave are indicated by a green diamond, those from the second wave are indicated by a blue circle; the red circle indicates the position of the original Canadian ON1 viruses. On both trees, only bootstrap support values >60 are shown on the branches. Scale bars indicate nucleotide substitutions per site.

