
Fig. 4.
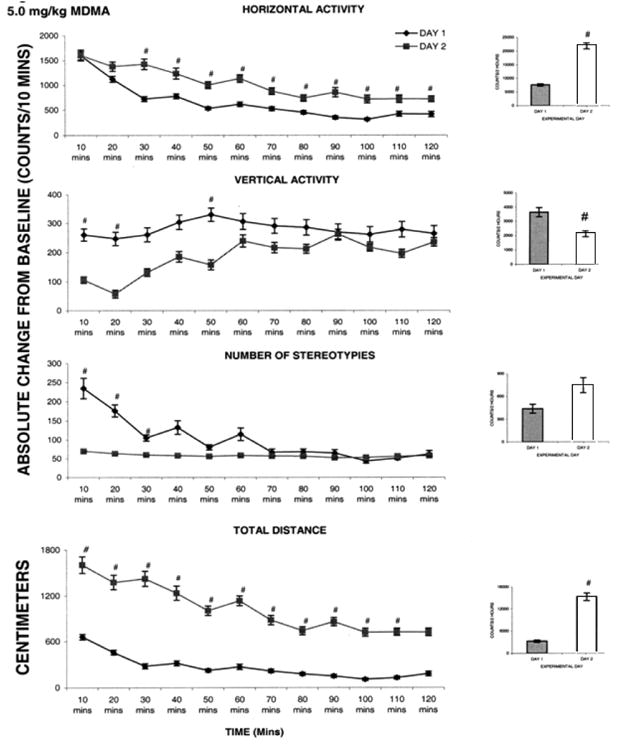
This figure summarizes (N=8) the acute effect of 5.0 mg/kg MDMA on four locomotor indices. On the left side are the sequential graphs of 10 minute temporal activity post injection and on the right side are the histograms of total activity under the temporal graph. # symbol indicates significant (P< 0.05) difference comparing the activity on experimental day ED 1 vs. ED 2.