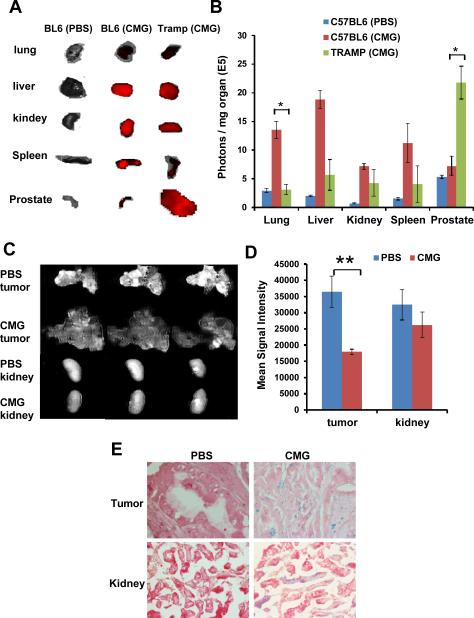
Fig.3.
Biodistribution of Cy5.5-CMG nanoparticles. The mice were sacrificed 4 hours after i.v. injection of Cy5.5-CMG-NPs and major organs were collected for fluorescence imaging. (A) Ex vivo fluorescence images of organs. (B) Average fluorescence intensity of each organ normalized to the weight of each organ. Error bars were based on six tumors per group (* p<0.05). (C) Ex vivo MR images of tumor and kidney tissues injected with CMG nanoparticles or PBS as control. (D) Mean signal intensity of tumors and kidneys after i.v. administration of CMG or PBS (** p<0.01). (E) Iron distribution shown by Prussian blue staining of tissue samples from mouse that received CMG nanoparticles.

