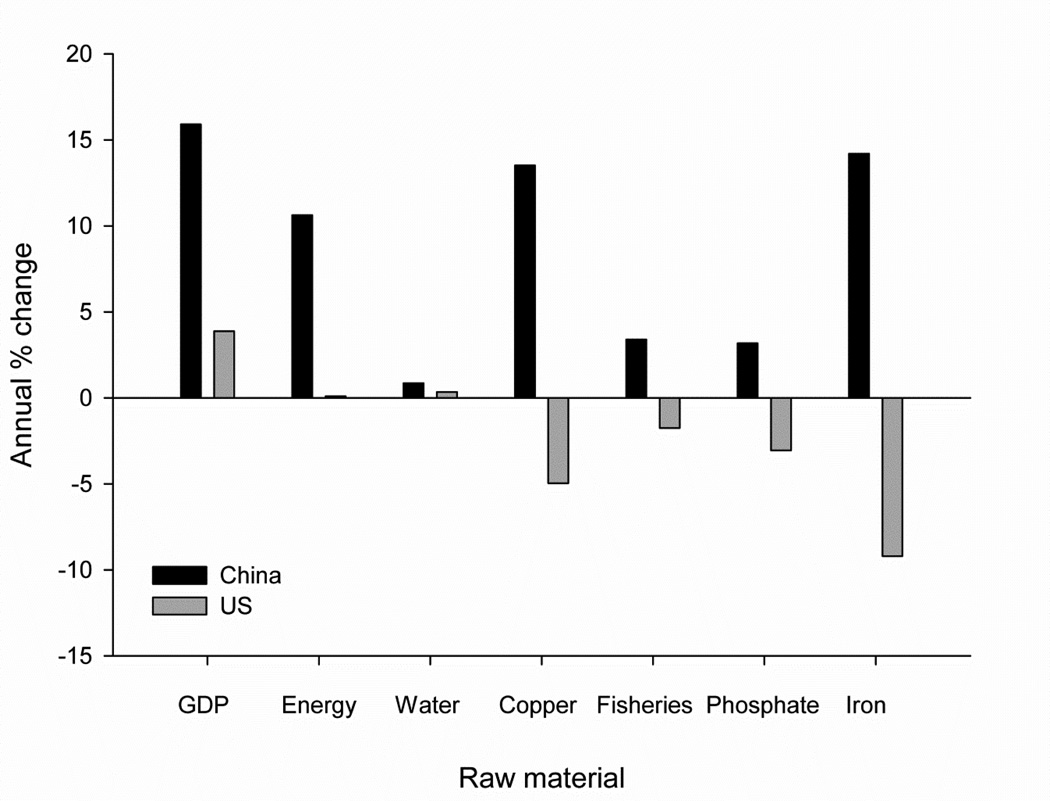
Fig. 2.
Annual percent change in GDP and resource consumption for the US and China from 2000 to 2010. China’s economic growth of more than 15% per year was accompanied by commensurate increases in consumption of energy, water, metals, phosphate, and fisheries. Much slower growth of the US economy consumed much less of all these resources. Some of the changes in individual commodities also reflect trends due to globalization. For example, the shift in manufacture and export of electronics from the US to China is reflected in the decrease copper consumption in the US and the large increase in China.

