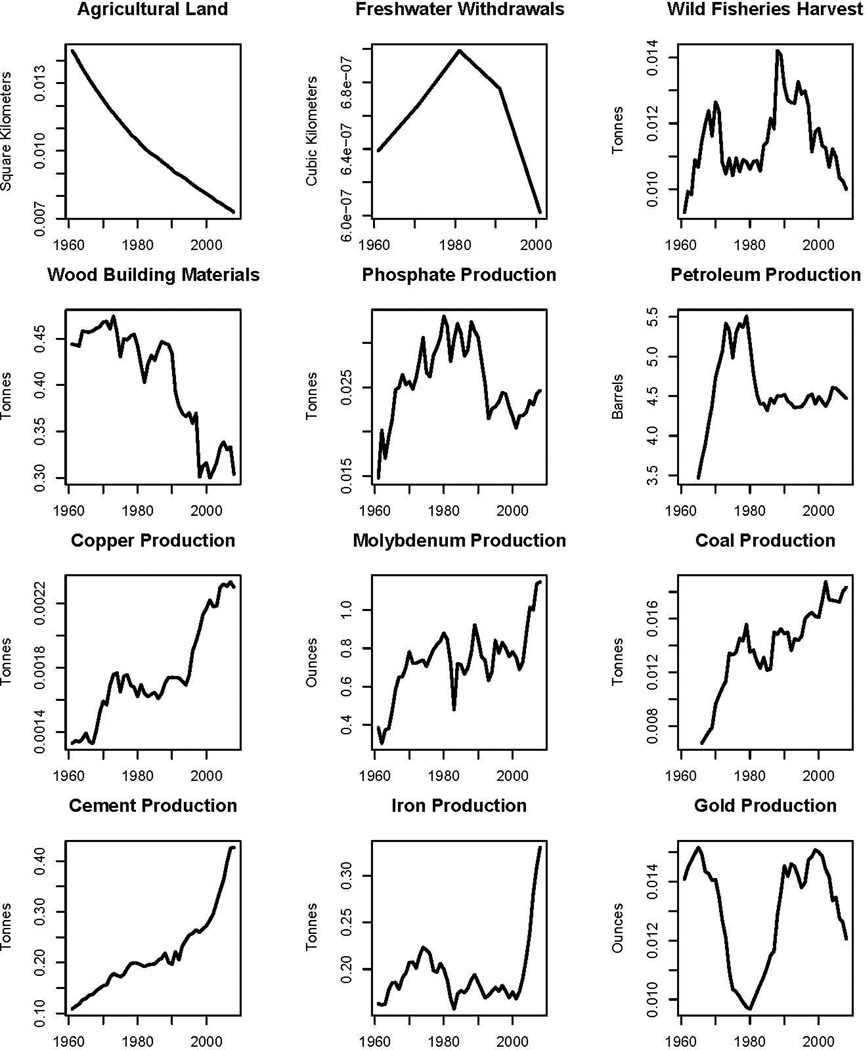
Fig. 3.
Trajectory of per capita extraction and consumption of natural resources since the 1960s. Note that per capita supplies of all these resources, except for iron and possibly molybdenum and cement, have peaked, often decades ago, and are now declining. Data sources: per capita values represent the total values divided by global population size as reported by the World Resources Institute (http://earthtrends.wri.org/). Individual sources for global production/consumption values are as follows: Agricultural land in km2 is from the World Development Indicators Database of the World Bank (http://data.worldbank.org/data-catalog/world-development-indicators) and represents the sum of arable, permanent crop, and permanent pasture lands. Freshwater withdrawal in km3 from 1960, 1970, 1980, and 1990 is from UNESCO http://webworld.unesco.org/water/ihp/db/shiklomanov/part%273/HTML/Tb_14.html) and for 2000 from The Pacific Institute (http://www.worldwater.org/data.html). Wild fisheries harvest in tonnes is from the FAO Fishery Statistical Collection Global Capture Production Database http://www.fao.org/fishery/statistics/global-capture-production/en) and is limited to diadromous and marine species. Wood building material production in tonnes is based on the FAO ForeSTAT database (http://faostat.fao.org/site/626/default.aspx), and represents the sum of compressed fiberboard, pulpwood+particles (conifer and non-conifer [C & NC]), chips and particles, hardboard, insulating board, medium density fiberboard, other industrial roundwood (C & NC), particle board, plywood, sawlogs+veneer logs (C & NC), sawn wood (C & NC), veneer sheets, and wood residues. Phosphate, copper, molybdenum, pig iron, gold, and combustible coal production data in tonnes is based on World Production values reported in the USGS Historical Statistics for Mineral and Material Commodities (http://minerals.usgs.gov/ds/2005/140/). Global coal production data is limited to 1966–2008. Petroleum production in barrels from 1965 to 2008 is based on The Statistical Review of World Energy http://www.bp.com/sectiongenericarticle800.do?categoryId=9037130&contentId=7068669) and represents all crude oil, shale oil, and oil sands plus the liquid content of natural gas where this is separately recovered. These data are reported in 1,000 barrels/day, and were transformed to barrels per capita per year. GDP in 1990 US dollars are from the World Resources Institute (http://earthtrends.wri.org/). All data were accessed May 2011 to October 2012. After Burger et al. (2012) with new graphs for iron, molybdenum, and gold added.

