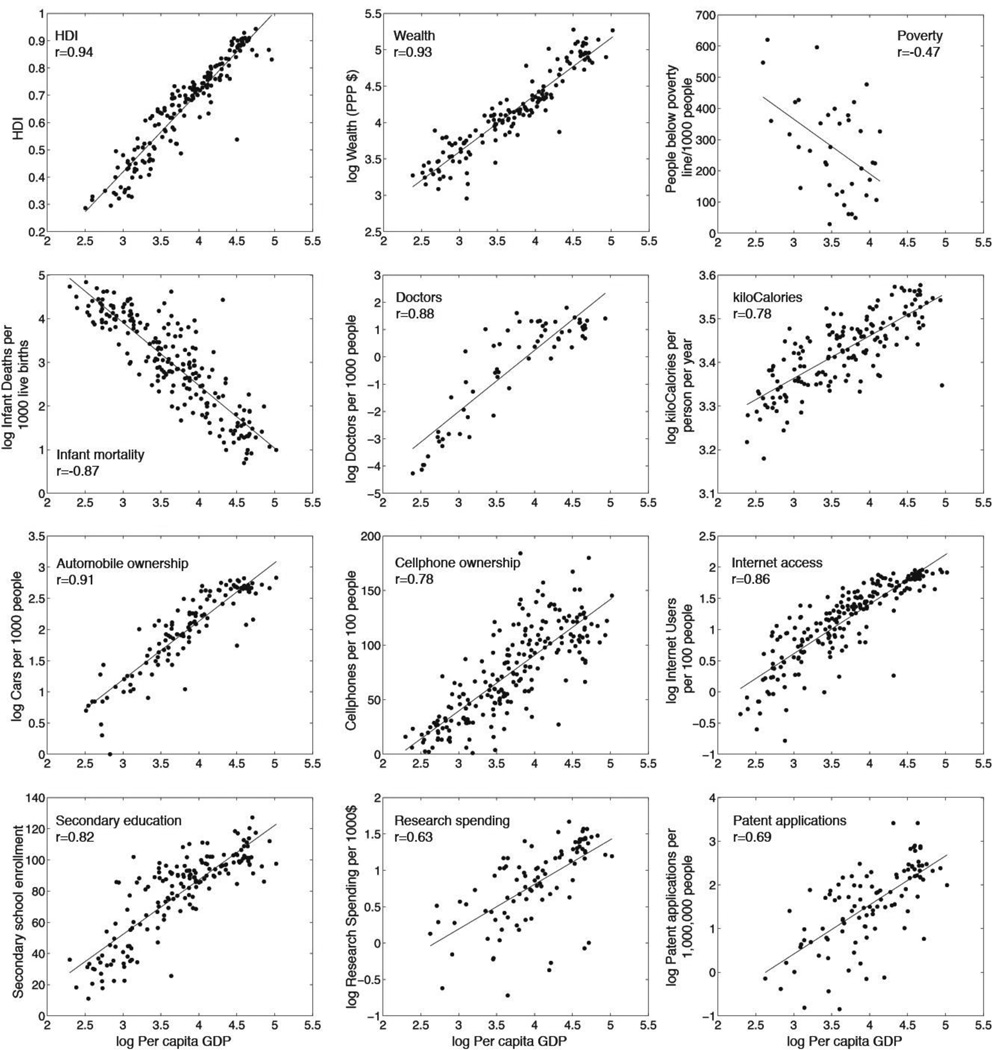
Fig. 4.
Variation across countries in relationships between GDP and variables that reflect standard of living and quality of life. First row: overall standard of living: A) Human Development Index (HDI), B) per capita wealth, C) poverty; second row: D) health: infant mortality, E) doctors, F) calories in diet; third row: technology: G) cars, H) cell phones, I) internet users; fourth row: education and research: J) secondary education, K) research spending, L) patents. In all cases each data point represents the value for a country, GDP is scaled logarithmically and plotted on the x-axis, the other variables are either log transformed or not, depending on which gives better fit, and correlation coefficients are given. Variables are either per capita or per hundred or thousand population as in the original source. Note that all variables are well correlated with GDP per capita, although the goodness of fit and exact form of the relationships vary. Data from http://databank.worldbank.org/data/home.aspx, accessed May 2011 to October 2012.

