Figure 5.

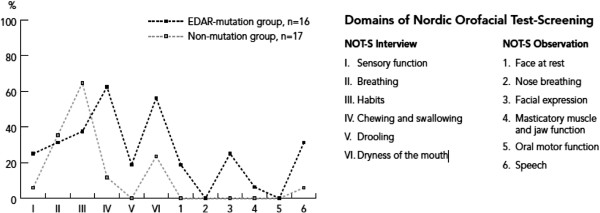
Orofacial dysfunction profiles based on frequencies of NOT-S domain scores (%) in the EDAR-mutation group (n = 16) and the non-mutation group (n = 17), respectively.

Orofacial dysfunction profiles based on frequencies of NOT-S domain scores (%) in the EDAR-mutation group (n = 16) and the non-mutation group (n = 17), respectively.