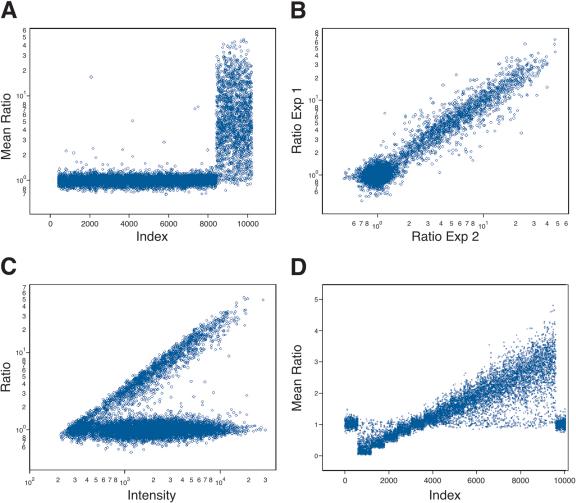
Figure 1.
The predictability of informatics and accuracy of the array measurements using 10K microarrays. (A) The results, where the samples hybridized are BglII representation and BglII representation depleted of fragments with a HindIII cleavage site. The Y-axis (Mean Ratio) is the mean measured ratio from two hybridizations of depleted representation to normal representation plotted in log scale. The X-axis (Index) is a sorted index, such that those probes that derive fromfragments that do not have an internal HindIII restriction cleavage site sort first and those with an internal HindIII site sort last. This allows the separation of these two subsets for visualization of the cleavage results. (B) The reproducibility of the duplicate experiments used to generate the average ratio in A. The Y-axis (Ratio Exp1) is the measured ratio from experiment 1, and the X-axis (Ratio Exp2) is the measured ratio of experiment 2. Both axes are plotted in log scale. (C) Graph of the normalized ratio on the Y-axis as a function of intensity of the sample that was not depleted on the X-axis. Both the ratio and intensity were plotted in log scale. (D) Data generated by simulation. The X-axis (Index) is a false index. Probes, in groups of 600, detect increasing copy number, from left to right; 600 flanking probes detect normal copy number. The Y-axis (Mean Ratio) is the mean ratio calculated from two hybridizations.

