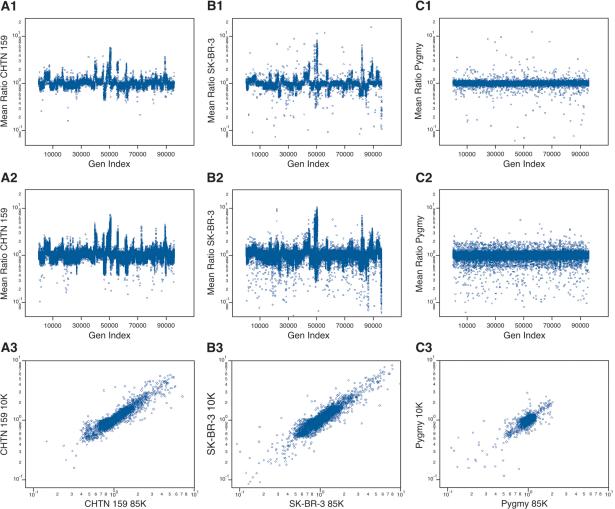
Figure 2.
The genomic profiles for (A) a primary breast cancer sample (CHTN159), with aneuploid nuclei compared with diploid nuclei from the same patient; (B) a breast cancer cell line compared with a normal male reference; and (C) a normal male compared with a normal male reference, using the 10K printed array (A1,B1,C1) and the 85K photoprint array (A2,B2,C2). In each case (rows 1 and 2), the Y-axis is the mean ratio, and the X-axis (Gen Index) is an index of the probes' genomic order based on the June 2002 assembly, that is, NCBI Build 30. The probes were put into genomic order concatenating Chromosomes 1 through Y. (A3,B3,C3) The correspondence of the ratios measured from “brother” probes (see text for details) present in the 10K and the 85K microarrays. The Y-axis is the measured ratio from the 10K microarray, and the X-axis is the measured ratio from the 85K microarray.

