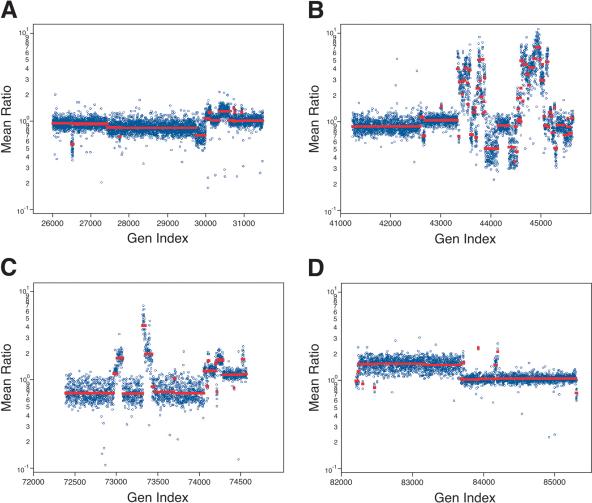
Figure 3.
Several chromosomes with varying copy number fluctuations from analysis of the tumor cell line SK-BR-3 as compared with the normal reference. The Y-axis (Mean Ratio) represents the mean ratio of two hybridizations in log scale. The X-axis (Gen Index) is an index of the genomic coordinates, as described above. (A) Copy number fluctuations identified for Chromosome 5, (B) for Chromosome 8, (C) for Chromosome 17, and (D) for the X-chromosome.

