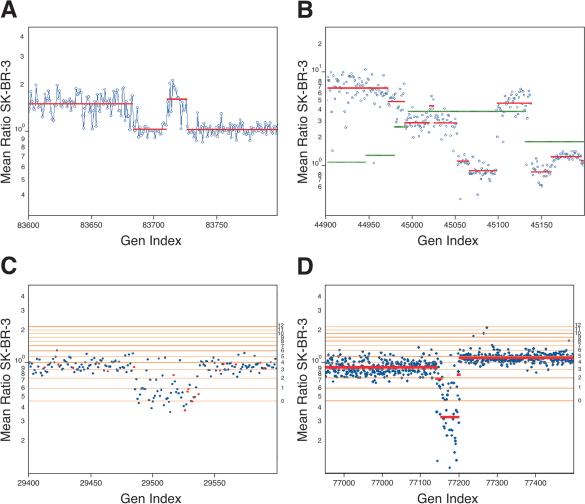
Figure 5.
In all panels, the Y-axis (Mean Ratio SK-BR-3) is the mean ratio of two hybridizations of SK-BR-3 compared with a normal reference in log scale. The X-axis (Gen Index) is the genomic index, as described. (A) A region from the X-chromosome with a region of loss. Plotted over the measured array ratio is the calculated segmentation value. (B) A region of Chromosome 8 (c-myc located to the right of the center of the graph) from results of SK-BR-3 in comparison to normal reference. Plotted on top of the data are the segmentation values for SK-BR-3 in comparison to the normal reference in red and the segmentation values for the primary tumor CHTN159 in green. (C) A lesion on Chromosome 5 demonstrating the resolving power of the 85K as compared with the 10K array. Results are from SK-BR-3 compared with a normal reference. Spots in red are from the 10K printed microarray, and spots in blue are from the 85K photoprint array. Horizontal lines are copy number estimates, based on modeling from mean-segment values. (D) Comparison of SK-BR-3 to normal reference, displaying a region of homozygous deletion on Chromosome 19. The mean-segment value is plotted as a red line, and horizontal lines are copy number estimates as described.

