
Figure 2.
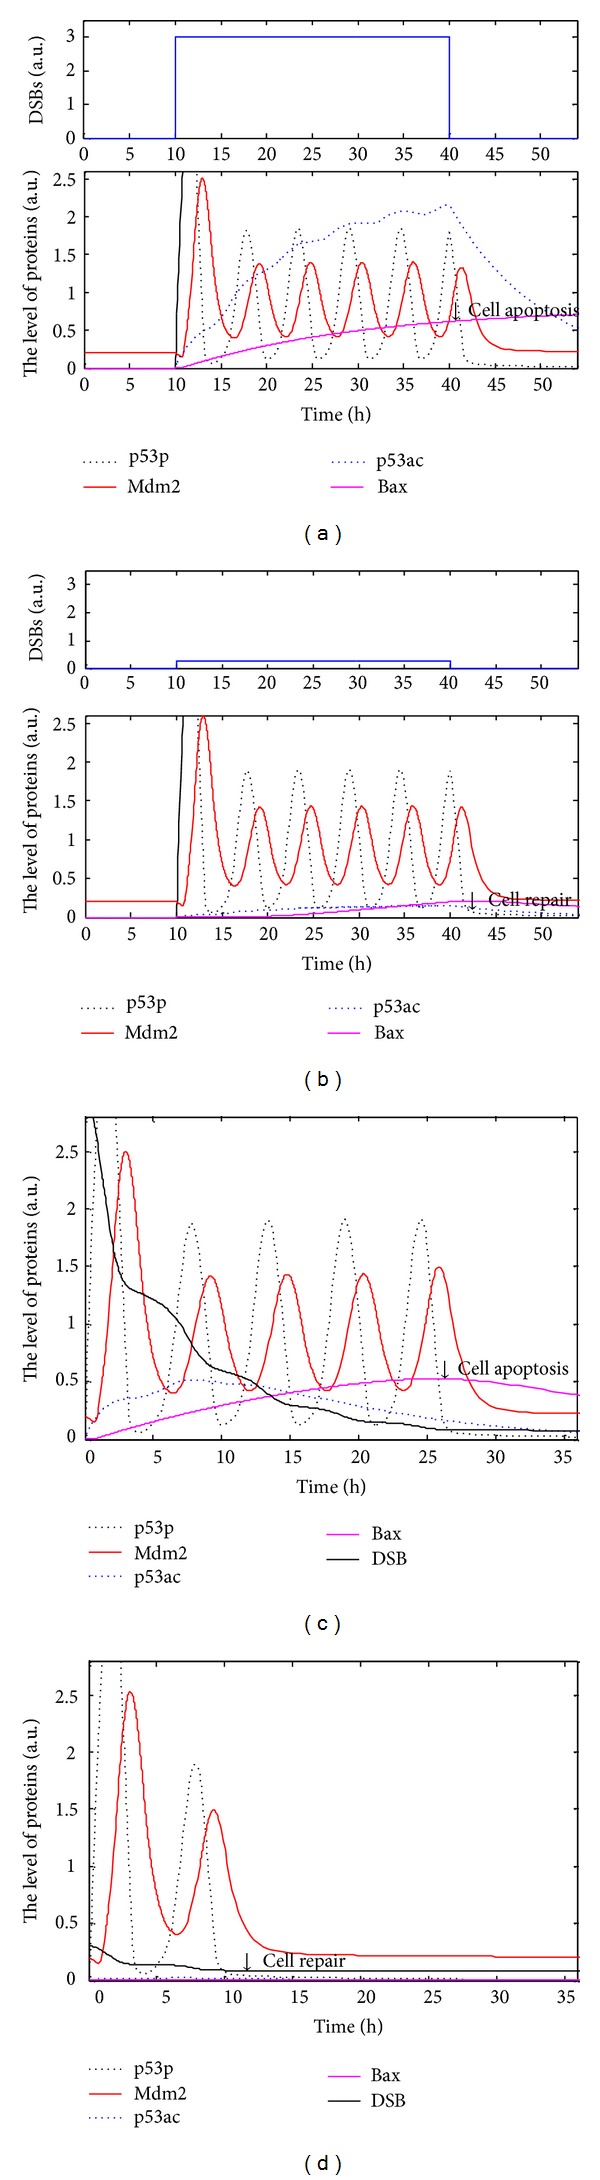
Simulations of the p53 regulatory networks under different types of DSBs. Black dotted lines indicates concentration of p53p; red solid lines Mdm2; blue dotted lines p53ac; carmine solid lines Bax; and black solid line DSB. (a, b) Pulsating DSB. (a) Pulse of DSBs takes 3 (a) and 0.3 (b). (c, d) DNA repair via p53 is considered. The initial DSBs take 3 (c) and 0.3 (d). (a, c) p53p oscillates while p53ac accumulates and induces cell apoptosis. (b, d) p53p oscillates while p53ac is hardly expressed during cell repair.