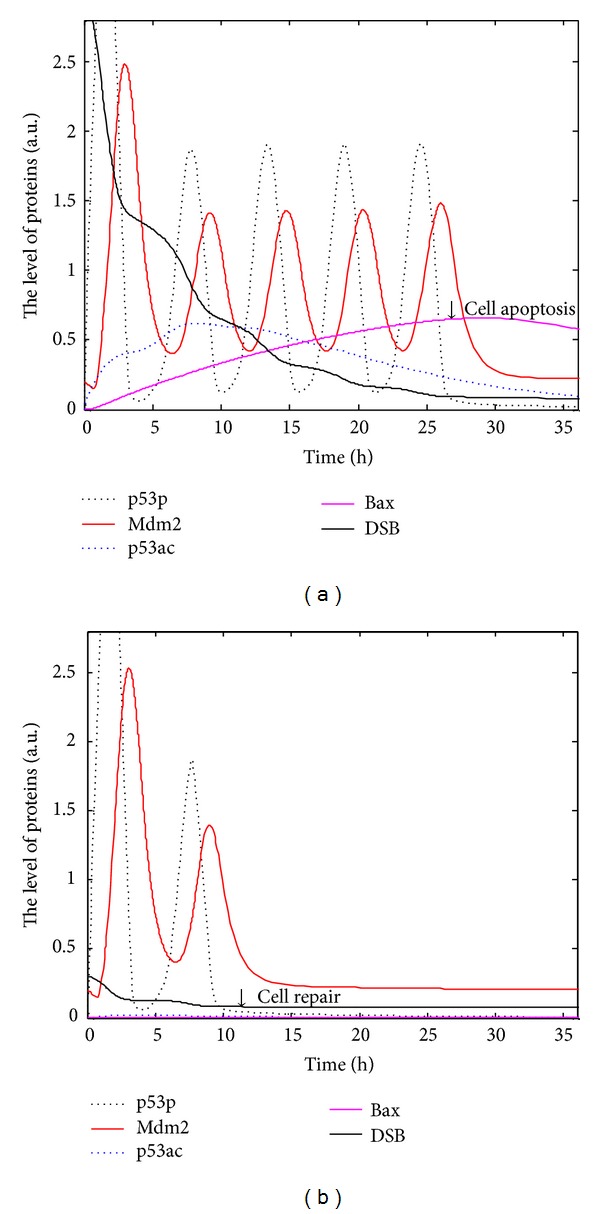
Figure 3.

Parameters robustness of the p53 regulatory networks. Black dotted line indicates concentration of p53p; red solid line Mdm2; blue dotted line p53ac; carmine solid line Bax; and black solid line DSB. (a) Production rates decrease 10% and degradation rates increase 10% in Figure 2(c). (b) Production rates increase 10% and degradation rates decrease 10% in Figure 2(d).
