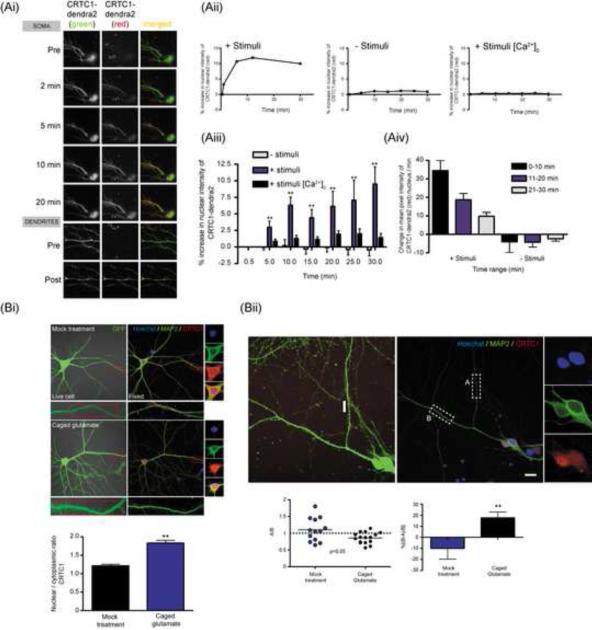
Fig 4. Synapse to nucleus translocation of CRTC1 in hippocampal neurons.
(A-i) Hippocampal neurons were transfected with CRTC1-dendra2 for 14-18 h before incubation in Tyrode’s solution in the presence or absence of calcium. After taking baseline images of CRTC1-dendra2 expression, cultures were incubated with stimuli (Leptomycin B, 10 nM; bicuculline 40 μM; forskolin 25 μM) or were unstimulated (Leptomycin B; 10 nM) and specific dendritic branches expressing the dendra2 construct were photoconverted from green to red with a UV pulse laser. Nuclear red dendra2 signal was imaged every 5 min for 30 min. (A-ii) The percent increase of photoconverted dendra2 signal in the nucleus was quantified as compared to baseline values. (A-iii) Group data (** p<0.001 relative to no stimulation). (A-iv) The rate at which photoconverted red dendra2 fusion protein entered the nucleus was quantified and plotted in 10 min intervals. (B-i) Hippocampal neurons were transduced with lentivirus expressing GFP. Glutamate was uncaged at distal dendrites of GFP-expressing neurons, followed by fixation and staining for MAP2 (green), CRTC1 (red) and Hoechst nuclear dye (blue). The red box indicates region of local uncaging. Neurons were identified after immunocytochemistry and the nuclear to cytoplasmic ratio of CRTC1 was quantified. (B-ii) Hippocampal neurons were treated as in (B-i). The amount of CRTC1 in dendrites adjacent to the region of photo-uncaging of glutamate was quantified (region A). As a control, a randomly selected branch of dendrite adjacent to the area of activation was also selected (region B), and the amount of CRTC1 was quantified. The ratio of region A to region B was determined and plotted as a scatter plot (** p<0.05, paired student t-test). A ratio of 1 indicates equal amounts of CRTC1 in the glutamate uncaged and adjacent control dendrite. Group data of the percent increase of CRTC1 in control relative to the uncaged dendrite for mock and glutamate-uncaged neurons (**p<0.05, paired student t-test). All scale bars, 10 μm.

