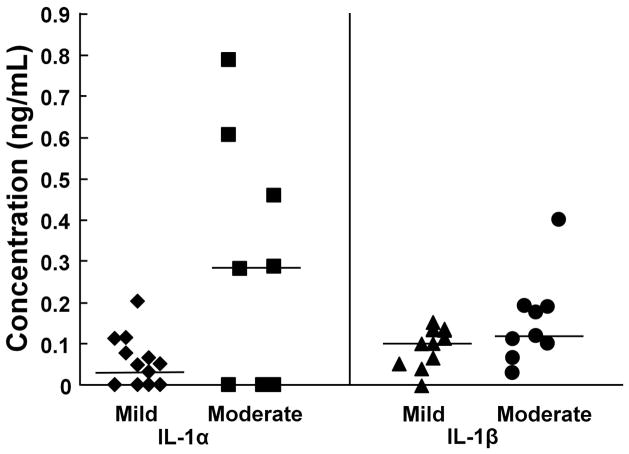
Figure 1.
Synovial fluid concentrations of IL-1. The synovial fluid concentration of IL-1α in porcine knee joints with mild (n = 14; diamonds) or moderate (n = 8; squares) osteoarthritis (OA) is indicated on the left panel. The synovial fluid concentration of IL-1β in porcine knee joints with mild (n = 12; triangles) or moderate (n = 9; circles) OA is indicated on the right. Each point indicates the concentration for an individual sample and the median for each group is indicated by the line.

